Our previous blog post was all about sequential load. In this article we are going to talk about small block size workloads.
So, we have a system with 10 Intel drives with CPUs installed that have 24 cores/48 threads. In this research we will show what part of the CPU load is created by our driver and RAID calculations modules (they are responsible for calculating checksums), and compare it to mdraid.
Estimation method: By varying the number of read and write jobs, we record the CPU load that is generated by our modules and, of course, the I/O performance
This is how this blog post is structured:
- Evaluating the performance of the array with random reads and writes of 4k blocks.
- Evaluating CPU load with the top utility.
- A closer look with FlameGraph.
System Performance
Let's start by showing the maximum performance level that the drives give:
- 4k random read
- 4k random write
- 4k Mix 50/50
It is important to precondition all drives as we have written repeatedly.
This is how the benchmark utility configuration looks like:
direct=1
ioengine=libaio
rw=randrw
rwmixread=0/50/100
bs=4k
numjobs=4
iodepth=64
norandommap
group_reporting
[drive0]
filename=/dev/nvme0n1
[drive1]
filename=/dev/nvme1n1
[drive2]
filename=/dev/nvme2n1
[drive3]
filename=/dev/nvme3n1
[drive4]
filename=/dev/nvme4n1
[drive5]
filename=/dev/nvme5n1
[drive6]
filename=/dev/nvme6n1
[drive7]
filename=/dev/nvme7n1
[drive8]
filename=/dev/nvme8n1
[drive9]
filename=/dev/nvme9n1
The following results were obtained:
| Pattern | Performance, IOps | Max performance (no precondition), IOps |
|---|---|---|
| 4k Random Read | 6486k | 7832k |
| 4k Random Write | 2973k | 4321k |
| 4k Mix 50/50 | 5794k | 7567k |
Without preconditioning, the performance is different and does not allow for reproducible results.
xiRAID Level 5 Performance
We combined the drives in RAID 5 and ran tests with a variable number of jobs.
This is how the fio configuration looked like:
Random read and write
| Num Jobs | Random read, kIOps | Random write, kIOps |
|---|---|---|
| 1 | 233 | 133 |
| 4 | 874 | 529 |
| 8 | 1661 | 859 |
| 16 | 3257 | 867 |
| 24 | 4439 | 910 |
| 32 | 5197 | 911 |
| 48 | 6245 | 976 |
For 48 jobs, let's compare the performance obtained with the expected one. Expected performance for all drives random write is calculated by dividing 4k Mix 50/50 performance (5794k) by 4 (2 reads and 2 writes).
| Num Jobs | All drives random read, kIOps | RAID 5 random read, kIOps | All drives random write, kIOps | RAID 5 random write, kIOps | Random write, kIOps |
|---|---|---|---|---|---|
| 48 | 6486 | 6245 | 2973 | 976 (1450 expected) | 976 |
For comparison, these are the same figures when using mdraid.
| Num Jobs | All drives random read, kIOps | RAID 5 random read, kIOps | All drives random write, kIOps | RAID 5 random write, kIOps | Random write, kIOps |
|---|---|---|---|---|---|
| 48 | 6486 | 1954 | 2973 | 169 (1450 expected) | 976 |
When reading, we were only able to fully utilize the backend capabilities with the number of jobs being equal to the number of CPU threads. And when writing, we could utilize it with 24 threads already.
As we know, the expected performance cannot exceed 1/4 of the mixed load and 1/2 of the random write performance because there are two reads and two writes per write for the checksum recalculation.
We looked at the output of the iostat utility and saw that queues and latency grow on different drives periodically. And since each io affects 4 drives out of 10 at random writes we often work at the speed of the lagging drive.
That’s why the performance of the drives at random writes in the array was lower than the total drives performance with an individual load, but consistent with the specification (200k iops per drive).
Anyway, if we trust the performance specification, we got the maximum capability of the hardware and it does not differ more than 2% from the performance of RAID 10, which is twice as expensive in terms of GB.
We will talk about performance expectations and profiling in a later blog post.
Mdraid showed predictably the worst results.
CPU Load, top
Now let's look at the output of the top utility.
xiRAID has its own thread responsible for processing applications IO and sending it to the drives on each system core (or among those that have been set in the settings). We will monitor how many CPU resources are occupied by these threads.
This is what the overall threads output looks like (check the CPU load in the following table):
PID    USER   PR   NI  VIRT RES SHR  S   %CPU  %MEM TIME+ COMMAND
1869   root   20   0   0    0   0    S   1.3   0.0  16:00.89 xi_t1233501152
1884   root   20   0   0    0   0    S   1.3   0.0  14:40.48 xi_t1233501152
1847   root   20   0   0    0   0    R   1.0   0.0  14:26.60 xi_t1233501152
1848   root   20   0   0    0   0    S   1.0   0.0  15:44.56 xi_t1233501152
1859   root   20   0   0    0   0    S   1.0   0.0  16:33.59 xi_t1233501152
1861   root   20   0   0    0   0    S   1.0   0.0  16:33.22 xi_t1233501152
1849   root   20   0   0    0   0    S   0.7   0.0  14:34.77 xi_t1233501152
1852   root   20   0   0    0   0    S   0.7   0.0  15:40.09 xi_t1233501152
1853   root   20   0   0    0   0    S   0.7   0.0  14:39.03 xi_t1233501152
1860   root   20   0   0    0   0    S   0.7   0.0  15:04.26 xi_t1233501152
1864   root   20   0   0    0   0    S   0.7   0.0  15:08.61 xi_t1233501152
1865   root   20   0   0    0   0    S   0.7   0.0  16:07.47 xi_t1233501152
1866   root   20   0   0    0   0    S   0.7   0.0  15:03.92 xi_t1233501152
1867   root   20   0   0    0   0    S   0.7   0.0  16:03.32 xi_t1233501152
1868   root   20   0   0    0   0    S   0.7   0.0  14:56.97 xi_t1233501152
1870   root   20   0   0    0   0    S   0.7   0.0  14:51.88 xi_t1233501152
1871   root   20   0   0    0   0    S   0.7   0.0  15:59.47 xi_t1233501152
1873   root   20   0   0    0   0    S   0.7   0.0  14:16.99 xi_t1233501152
1874   root   20   0   0    0   0    S   0.7   0.0  15:23.88 xi_t1233501152
1878   root   20   0   0    0   0    S   0.7   0.0  15:35.44 xi_t1233501152
1885   root   20   0   0    0   0    S   0.7   0.0  15:33.62 xi_t1233501152
1893   root   20   0   0    0   0    S   0.7   0.0  14:25.39 xi_t1233501152
1850   root   20   0   0    0   0    S   0.3   0.0  15:44.30 xi_t1233501152
1851   root   20   0   0    0   0    S   0.3   0.0  14:35.36 xi_t1233501152
1855   root   20   0   0    0   0    S   0.3   0.0  15:46.20 xi_t1233501152
1856   root   20   0   0    0   0    S   0.3   0.0  14:26.80 xi_t1233501152
1857   root   20   0   0    0   0    S   0.3   0.0  15:38.21 xi_t1233501152
1858   root   20   0   0    0   0    S   0.3   0.0  14:29.17 xi_t1233501152
1862   root   20   0   0    0   0    S   0.3   0.0  15:06.10 xi_t1233501152
1872   root   20   0   0    0   0    S   0.3   0.0  15:30.98 xi_t1233501152
1875   root   20   0   0    0   0    S   0.3   0.0  14:13.06 xi_t1233501152
1876   root   20   0   0    0   0    S   0.3   0.0  15:23.23 xi_t1233501152
1877   root   20   0   0    0   0    S   0.3   0.0  14:10.52 xi_t1233501152
1879   root   20   0   0    0   0    S   0.3   0.0  14:01.90 xi_t1233501152
1880   root   20   0   0    0   0    S   0.3   0.0  14:06.24 xi_t1233501152
1882   root   20   0   0    0   0    S   0.3   0.0  14:06.32 xi_t1233501152
1883   root   20   0   0    0   0    S   0.3   0.0  15:03.95 xi_t1233501152
1886   root   20   0   0    0   0    S   0.3   0.0  14:34.59 xi_t1233501152
1887   root   20   0   0    0   0    S   0.3   0.0  15:31.08 xi_t1233501152
1888   root   20   0   0    0   0    S   0.3   0.0  15:48.91 xi_t1233501152
1889   root   20   0   0    0   0    S   0.3   0.0  14:32.13 xi_t1233501152
1890   root   20   0   0    0   0    S   0.3   0.0  15:44.32 xi_t1233501152
1891   root   20   0   0    0   0    S   0.3   0.0  14:24.22 xi_t1233501152
1892   root   20   0   0    0   0    S   0.3   0.0  15:41.69 xi_t1233501152
1894   root   20   0   0    0   0    S   0.3   0.0  15:48.06 xi_t1233501152
1895   root   20   0   0    0   0    S   0.3   0.0  14:21.79 xi_t1233501152
1854   root   20   0   0    0   0    S   0.0   0.0  15:32.21 xi_t1233501152
1881   root   20   0   0    0   0    S   0.0   0.0  15:08.23 xi_t1233501152
342839 root   20   0   0    0   0    S   0.0   0.0   0:00.00 xi_xiraid_recon
342840 root   20   0   0    0   0    S   0.0   0.0   0:00.38 xi_xiraid_init
342841 root   20   0   0    0   0    D   0.0   0.0   0:00.05 xi_xiraid_md_fl
342842 root   20   0   0    0   0    S   0.0   0.0   0:00.00 xi_xiraid_restr
We made a series of three measurements with a pause of 3 seconds and calculated the average load value. The tests have been conducted with a queue depth of 64.
Random read
| Num Jobs | xiRAID, % CPU Load |
|---|---|
| 1 | 0.6 |
| 4 | 4.7 |
| 8 | 10.3 |
| 16 | 10.6 |
| 24 | 13.3 |
| 32 | 15.4 |
| 48 | 28.5 |
Random write
| Num Jobs | xiRAID, % CPU Load |
|---|---|
| 1 | 2.6% |
| 4 | 7.5% |
| 8 | 9.3% |
| 16 | 12.8% |
| 24 | 14.7% |
| 32 | 18.7% |
| 48 | 22.3% |
At high load, where the number of fio jobs is close to the number of virtual cores, we might see significant numbers (28%).
But what is quite interesting is that the 48 write jobs, which cause a large number of recalculations, load the cores to a lesser extent than the read. How did it happen? We’ll take a closer look in the next part.
Now let’s look at mdraid to make a comparison.
Top read, 48 jobs
PID     USER      PR   NI VIRT   RES      SHR  S  %CPU   %MEM  TIME+ COMMAND
2984935 root      20   0  861792 439388   2240 R  97.3   0.3   1:05.02 fio
2984946 root      20   0  861836 439132   2004 R  97.3   0.3   1:05.08 fio
2984950 root      20   0  861852 439124   2004 R  97.3   0.3   1:05.08 fio
2984976 root      20   0  861956 439056   1944 R  97.3   0.3   1:05.03 fio
2984917 root      20   0  861724 439140   2000 R  97.2   0.3   1:05.01 fio
2984919 root      20   0  861732 439392   2244 R  97.2   0.3   1:04.92 fio
2984922 root      20   0  861740 439304   2156 R  97.2   0.3   1:04.88 fio
2984923 root      20   0  861744 439280   2132 R  97.2   0.3   1:05.01 fio
2984925 root      20   0  861752 439140   2008 R  97.2   0.3   1:04.89 fio
2984927 root      20   0  861760 439136   2004 R  97.2   0.3   1:05.02 fio
2984933 root      20   0  861784 439120   1992 R  97.2   0.3   1:05.03 fio
2984934 root      20   0  861788 439064   1936 R  97.2   0.3   1:05.07 fio
2984941 root      20   0  861816 439392   2244 R  97.2   0.3   1:05.10 fio
2984947 root      20   0  861840 439380   2232 R  97.2   0.3   1:05.03 fio
2984949 root      20   0  861848 439316   2168 R  97.2   0.3   1:05.01 fio
2984951 root      20   0  861856 439000   1876 R  97.2   0.3   1:04.87 fio
2984952 root      20   0  861860 439272   2124 R  97.2   0.3   1:05.02 fio
2984953 root      20   0  861864 439056   1932 R  97.2   0.3   1:05.01 fio
2984958 root      20   0  861884 439128   2004 R  97.2   0.3   1:04.77 fio
2984959 root      20   0  861888 439384   2236 R  97.2   0.3   1:04.77 fio
2984960 root      20   0  861892 439268   2120 R  97.2   0.3   1:05.05 fio
2984962 root      20   0  861900 439040   1924 R  97.2   0.3   1:04.91 fio
2984965 root      20   0  861912 439032   1920 R  97.2   0.3   1:04.91 fio
2984966 root      20   0  861916 439380   2232 R  97.2   0.3   1:04.92 fio
2984967 root      20   0  861920 439108   1992 R  97.2   0.3   1:04.82 fio
2984968 root      20   0  861924 439164   2016 R  97.2   0.3   1:04.93 fio
2984969 root      20   0  861928 439120   2004 R  97.2   0.3   1:04.98 fio
2984970 root      20   0  861932 439012   1900 R  97.2   0.3   1:05.01 fio
2984971 root      20   0  861936 439316   2168 R  97.2   0.3   1:04.98 fio
2984972 root      20   0  861940 439356   2208 R  97.2   0.3   1:05.08 fio
2984973 root      20   0  861944 439284   2136 R  97.2   0.3   1:04.95 fio
2984978 root      20   0  861964 439120   2004 R  97.2   0.3   1:04.99 fio
2984916 root      20   0  861720 439380   2232 R  97.2   0.3   1:05.02 fio
2984918 root      20   0  861728 439280   2132 R  97.2   0.3   1:04.99 fio
2984921 root      20   0  861736 439376   2228 R  97.2   0.3   1:04.77 fio
2984924 root      20   0  861748 439384   2236 R  97.2   0.3   1:04.96 fio
2984928 root      20   0  861764 439136   2008 R  97.2   0.3   1:04.96 fio
2984929 root      20   0  861768 439388   2240 R  97.2   0.3   1:04.88 fio
2984930 root      20   0  861772 439108   1976 R  97.2   0.3   1:04.91 fio
2984931 root      20   0  861776 439136   2008 R  97.2   0.3   1:04.95 fio
2984936 root      20   0  861796 439136   2008 R  97.2   0.3   1:04.91 fio
2984939 root      20   0  861808 438964   1848 R  97.2   0.3   1:05.07 fio
Top write, 48 jobs
PID     USER  PR  NI   VIRT    RES    SHR S  %CPU   %MEM  TIME+ COMMAND
2975442 root  20  0       0      0      0 R  93.6   0.0   1:37.34 md0_raid5
2984481 root  20  0  861944 439372   2216 R  57.3   0.3   0:42.16 fio
2984425 root  20  0  861724 439408   2252 R  55.9   0.3   0:41.01 fio
2984482 root  20  0  861948 439392   2236 R  55.4   0.3   0:42.33 fio
2984445 root  20  0  861800 439384   2228 R  53.1   0.3   0:41.78 fio
2984471 root  20  0  861904 439392   2236 R  52.6   0.3   0:41.75 fio
2984433 root  20  0  861752 439392   2236 R  52.4   0.3   0:41.05 fio
2984434 root  20  0  861756 439408   2252 D  52.4   0.3   0:41.81 fio
2984470 root  20  0  861900 439140   2012 R  52.3   0.3   0:41.94 fio
2984442 root  20  0  861788 439404   2248 R  52.2   0.3   0:41.57 fio
2984487 root  20  0  861968 439416   2260 R  52.2   0.3   0:41.62 fio
2984460 root  20  0  861860 438988   1864 R  51.4   0.3   0:41.75 fio
2984473 root  20  0  861912 439004   1880 R  51.0   0.3   0:41.09 fio
2984479 root  20  0  861936 439412   2256 R  50.7   0.3   0:41.89 fio
2984432 root  20  0  861748 439400   2244 R  50.1   0.3   0:41.32 fio
2984447 root  20  0  861808 439408   2252 R  50.1   0.3   0:38.21 fio
2984472 root  20  0  861908 439408   2252 R  50.0   0.3   0:40.20 fio
2984424 root  20  0  861720 439416   2260 R  49.9   0.3   0:42.15 fio
2984448 root  20  0  861812 439388   2232 R  49.5   0.3   0:37.92 fio
2984423 root  20  0  861716 439412   2256 R  49.1   0.3   0:40.98 fio
2984474 root  20  0  861916 439396   2240 R  48.6   0.3   0:40.91 fio
2984461 root  20  0  861864 439392   2236 R  48.5   0.3   0:42.29 fio
2984464 root  20  0  861876 439412   2256 R  48.5   0.3   0:41.37 fio
2984475 root  20  0  861920 439364   2208 R  48.5   0.3   0:40.72 fio
2984485 root  20  0  861960 439412   2256 R  48.5   0.3   0:36.81 fio
2984486 root  20  0  861964 439412   2256 R  48.4   0.3   0:41.41 fio
2984439 root  20  0  861776 439392   2236 R  48.3   0.3   0:37.59 fio
2984483 root  20  0  861952 439356   2200 R  48.3   0.3   0:40.38 fio
2984436 root  20  0  861764 439116   1980 R  48.2   0.3   0:42.01 fio
2984454 root  20  0  861836 439404   2248 R  48.2   0.3   0:37.76 fio
2984444 root  20  0  861796 439368   2212 R  48.1   0.3   0:41.41 fio
2984453 root  20  0  861832 439412   2256 R  47.9   0.3   0:41.14 fio
2984476 root  20  0  861924 439380   2224 R  47.1   0.3   0:36.53 fio
2984450 root  20  0  861820 439364   2208 R  46.9   0.3   0:38.01 fio
2984427 root  20  0  861728 439408   2252 R  46.7   0.3   0:38.52 fio
2984437 root  20  0  861768 439412   2256 R  46.7   0.3   0:41.87 fio
2984452 root  20  0  861828 439408   2252 R  46.5   0.3   0:36.73 fio
2984458 root  20  0  861852 439344   2188 R  46.5   0.3   0:36.84 fio
2984457 root  20  0  861848 439392   2236 R  46.2   0.3   0:40.70 fio
2984480 root  20  0  861940 439392   2236 R  46.2   0.3   0:41.96 fio
2984562 root  20  0       0      0      0 R  46.2   0.0   0:31.19 kworker/u130:39+raid5wq
2984451 root  20  0  861824 439408   2252 R  45.9   0.3   0:36.80 fio
2984502 root  20  0       0      0      0 R  45.9   0.0   0:28.64 kworker/u129:0+raid5wq
2984430 root  20  0  861740 439408   2252 R  45.5   0.3   0:37.56 fio
2984455 root  20  0  861840 439332   2176 R  45.4   0.3   0:37.09 fio
2984429 root  20  0  861736 439416   2260 R  45.3   0.3   0:36.59 fio
2984550 root  20  0       0      0      0 R  45.2   0.0   0:26.30 kworker/u130:30+raid5wq
2984613 root  20  0       0      0      0 I  45.1   0.0   0:18.22 kworker/u130:47-raid5wq
2984443 root  20  0  861792 439392   2236 R  45.0   0.3   0:36.00 fio
2984468 root  20  0  861892 439328   2172 R  44.9   0.3   0:37.44 fio
2984440 root  20  0  861780 439392   2236 R  44.8   0.3   0:36.67 fio
2984526 root  20  0       0      0      0 I  44.4   0.0   0:31.96 kworker/u129:10-raid5wq
2984466 root  20  0  861884 439408   2252 R  44.3   0.3   0:37.13 fio
2984462 root  20  0  861868 439412   2256 R  44.1   0.3   0:37.59 fio
2984469 root  20  0  861896 439368   2212 D  44.1   0.3   0:36.81 fio
2984449 root  20  0  861816 439416   2260 R  43.9   0.3   0:37.07 fio
2984438 root  20  0  861772 439312   2156 R  43.8   0.3   0:36.89 fio
2984484 root  20  0  861956 439412   2256 R  43.8   0.3   0:37.37 fio
2984522 root  20  0       0      0      0 I  43.8   0.0   0:31.68 kworker/u129:6-raid5wq
2984428 root  20  0  861732 439416   2260 R  43.7   0.3   0:37.03 fio
2984431 root  20  0  861744 439416   2260 R  43.6   0.3   0:36.94 fio
2984441 root  20  0  861784 439412   2256 R  43.6   0.3   0:36.72 fio
2984467 root  20  0  861888 439412   2256 R  43.5   0.3   0:36.60 fio
2984477 root  20  0  861928 439352   2196 R  43.3   0.3   0:34.96 fio
2984536 root  20  0       0      0      0 I  43.3   0.0   0:26.59 kworker/u129:21-raid5wq
2984498 root  20  0       0      0      0 R  43.2   0.0   0:26.69 kworker/u130:8+raid5wq
2984446 root  20  0  861804 439408   2252 R  43.1   0.3   0:36.62 fio
2984478 root  20  0  861932 439396   2240 R  43.1   0.3   0:36.45 fio
2984557 root  20  0       0      0      0 R  43.0   0.0   0:24.01 kworker/u130:35+raid5wq
2984465 root  20  0  861880 439392   2236 R  42.9   0.3   0:37.22 fio
2984515 root  20  0       0      0      0 R  42.8   0.0   0:18.56 kworker/u130:23+raid5wq
2984497 root  20  0       0      0      0 I  42.5   0.0   0:30.57 kworker/u130:7-raid5wq
2984459 root  20  0  861856 439368   2212 R  42.4   0.3   0:36.38 fio
2984463 root  20  0  861872 439376   2220 R  42.0   0.3   0:36.39 fio
2984521 root  20  0       0      0      0 I  41.9   0.0   0:24.62 kworker/u129:5-raid5wq
2984456 root  20  0  861844 439412   2256 R  41.7   0.3   0:37.02 fio
2984496 root  20  0       0      0      0 R  41.6   0.0   0:30.33 kworker/u130:6+raid5wq
2984491 root  20  0       0      0      0 R  41.5   0.0   0:27.35 kworker/u130:1+raid5wq
2984608 root  20  0       0      0      0 I  41.5   0.0   0:15.01 kworker/u129:44-raid5wq
2984435 root  20  0  861760 439404   2248 R  41.4   0.3   0:35.97 fio
With mdraid, all 48 cores are loaded with fio when reading. And when writing, the cores are also loaded, but their load is distributed between fio and kworker/u130:39+raid5wq.
FlameGraph Comparison
xiRAID FlameGraph
Let’s make two flamegraphs for read and write. To make it easy to perceive, we applied a filter that only includes our function calls.
Read:
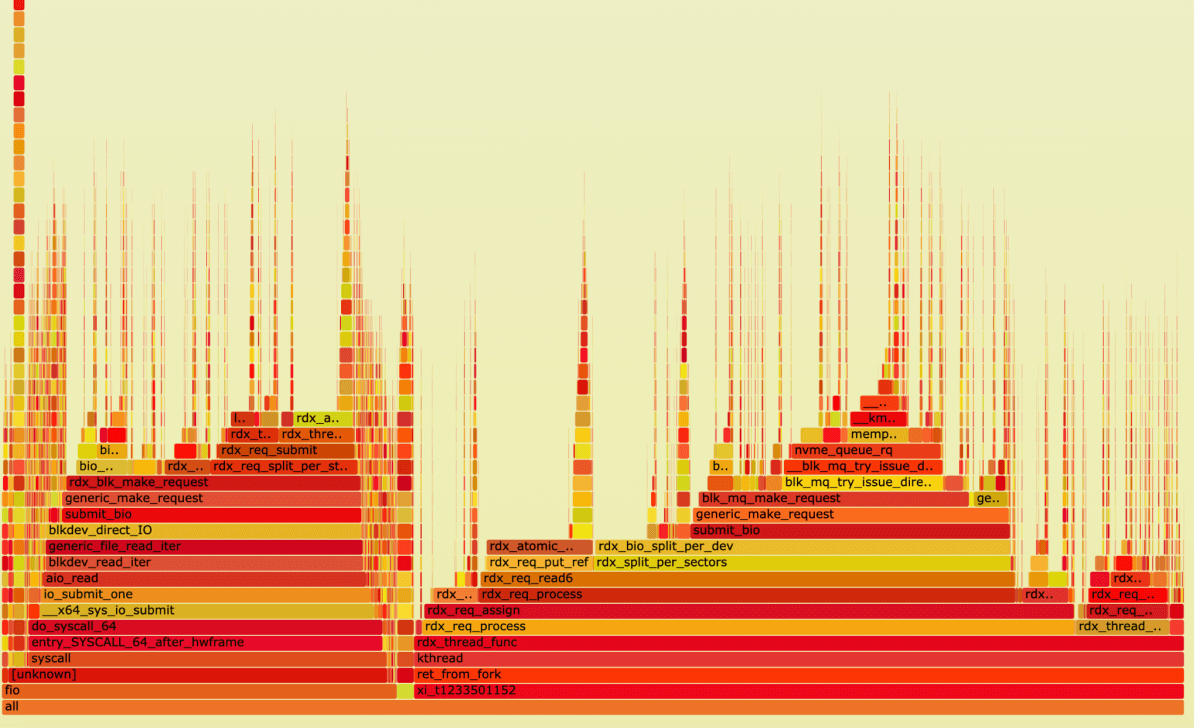
Let’s look closer at the xi_t1233501152 process:
41% of time in this process is taken up by the submit bio system call.
It means that, at a high load of cores, with 48 fio jobs running, 41% of the time is actually spent executing the OS kernel-drive interaction.
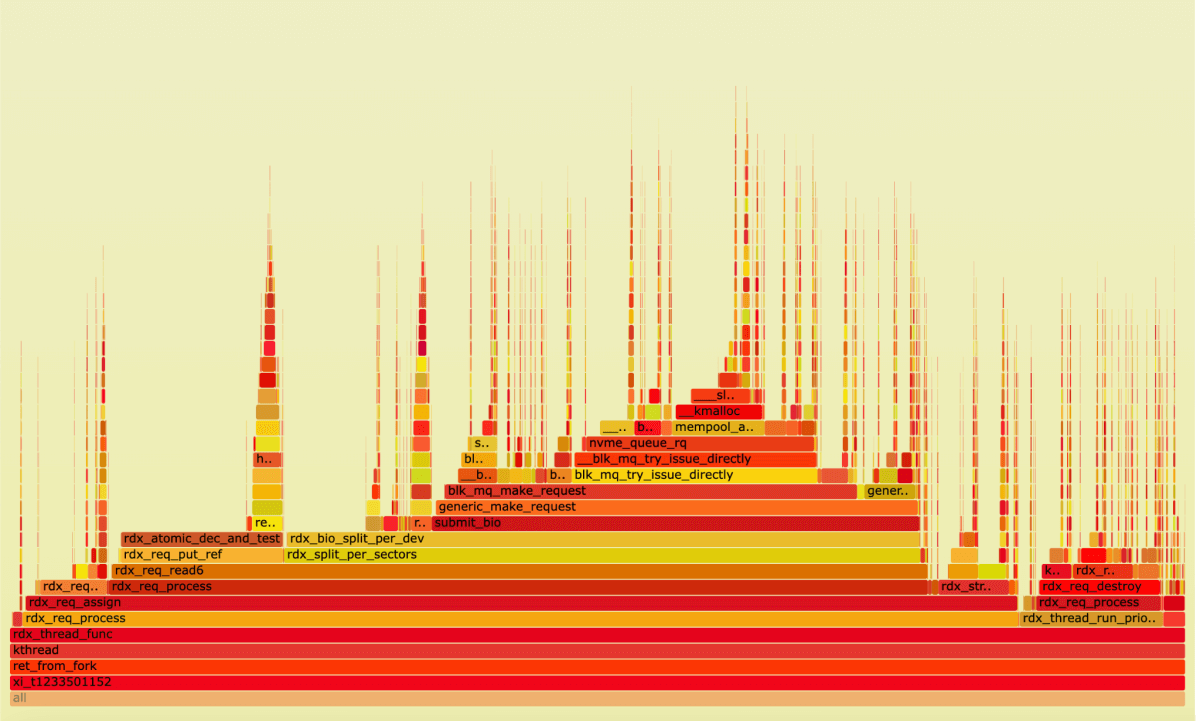
Write:
Let’s take a look at our threads:
We can see 4 submit_bio calls (which makes sense for read-modify-write), taking up a total of 37% of the time spent in the thread.
Now let's take a look at the Recalculation function.
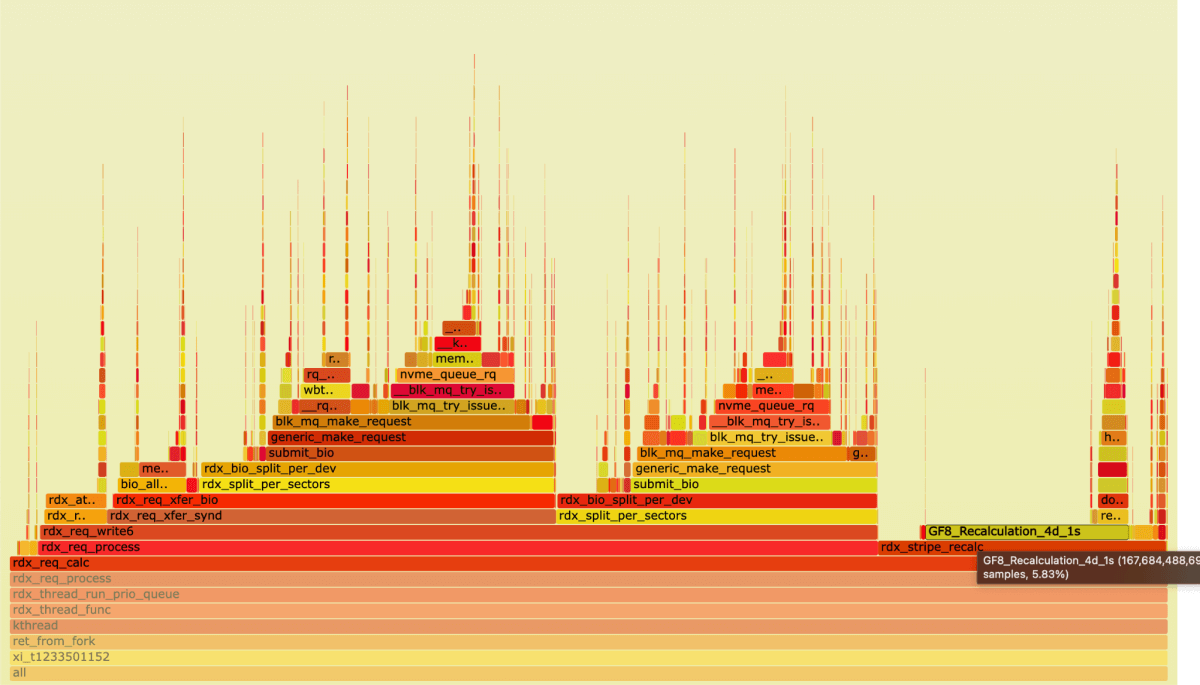
For the recalculations, we spent about 6% of the time that was used by our module.
Just to remind you, the load on the CPU was 22.3%.
Of course, you don't need to build a FlameGraph to understand how much time we spent on a particular function, just use perf top.
Run this:
Result:
------------------------
5.76% [kernel] [k] GF8_Recalculation_4d_1s
3.03% [kernel] [k] rdx_bio_split_per_dev
1.30% [kernel] [k] read_tsc
1.06% [kernel] [k] rdx_req_xfer_synd
1.03% [kernel] [k] get_page_from_freelist
1.03% [kernel] [k] nvme_irq
1.03% [kernel] [k] __free_pages_ok
1.02% [kernel] [k] ___slab_alloc
0.93% [kernel] [k] __slab_free
0.84% [kernel] [k] _raw_spin_lock
0.79% [kernel] [k] ktime_get
0.77% [kernel] [k] rdx_atomic_dec_and_test
0.75% [kernel] [k] __const_udelay
0.73% [kernel] [k] blk_mq_get_request
0.72% [kernel] [k] native_read_msr
0.66% [kernel] [k] rdx_bio_end_io
0.63% [kernel] [k] bio_alloc_bioset
0.63% [kernel] [k] nvme_map_data
0.63% [kernel] [k] native_write_msr
0.61% [kernel] [k] rdx_req_xfer_bio
0.60% [kernel] [k] rq_qos_wait
0.58% [kernel] [k] kmem_cache_free
0.56% [kernel] [k] __bio_add_page
0.55% [kernel] [k] __list_del_entry_valid
0.53% [kernel] [k] rdx_req_check_bitmap6
0.53% [kernel] [k] irq_entries_start
0.52% [kernel] [k] wbt_track
mdraid FlameGraph
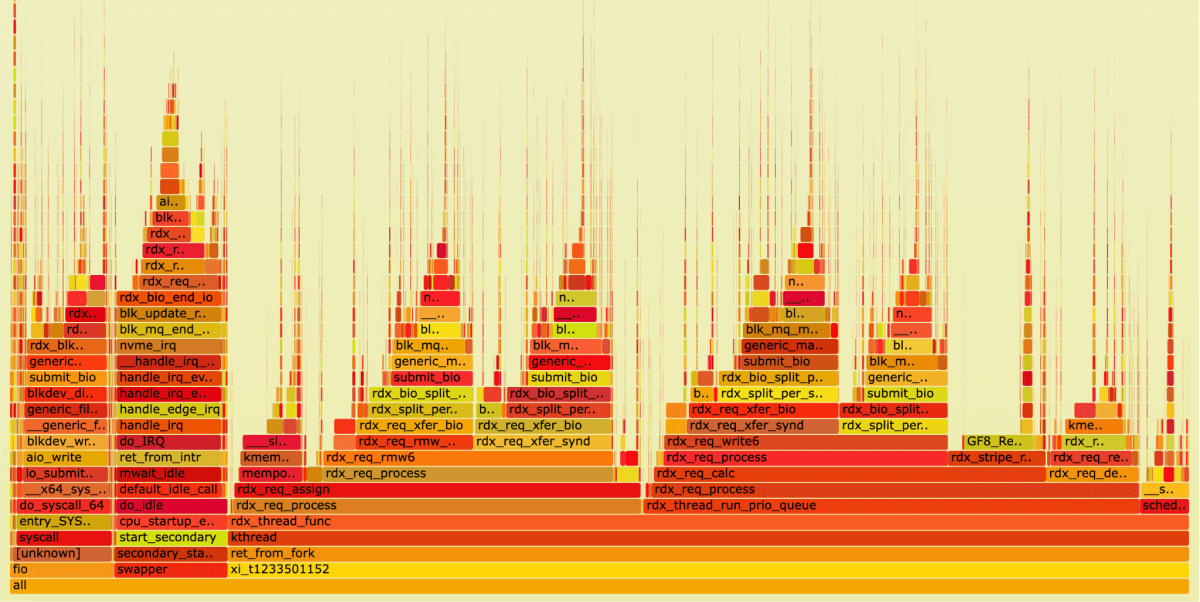
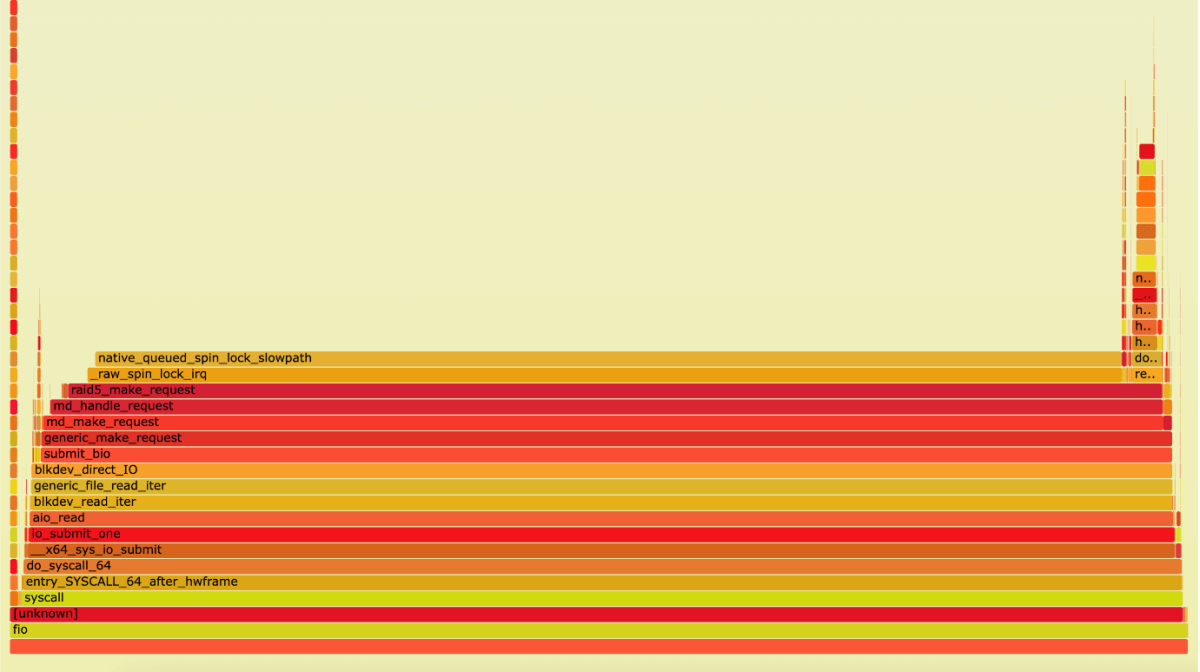
Let’s look at mdraid.
Read:
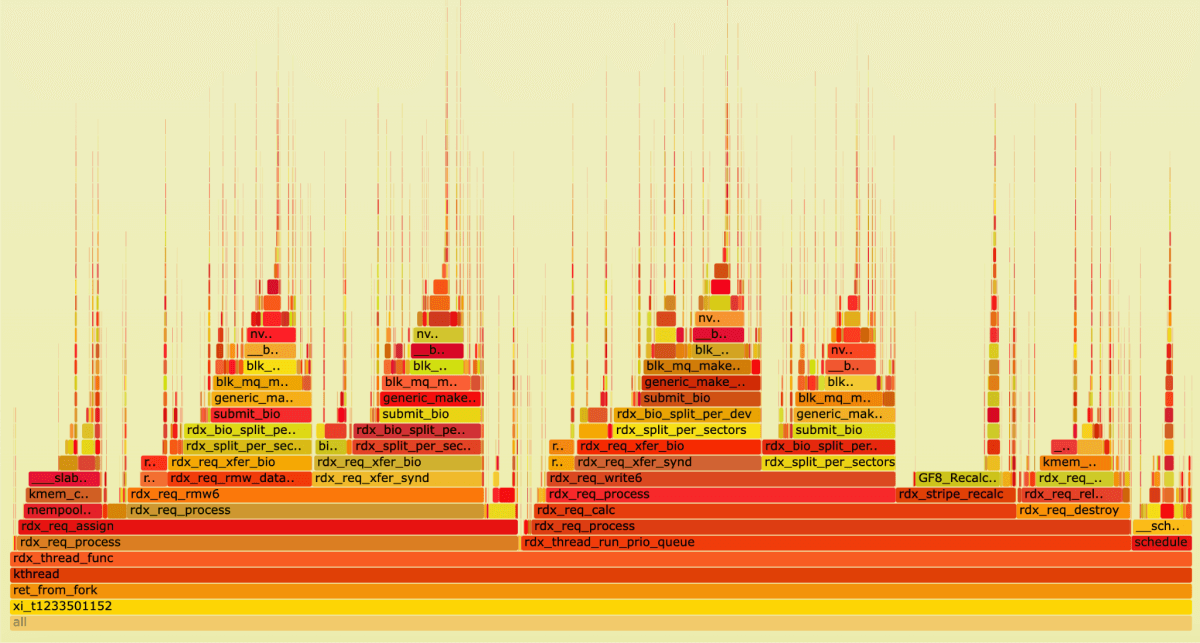
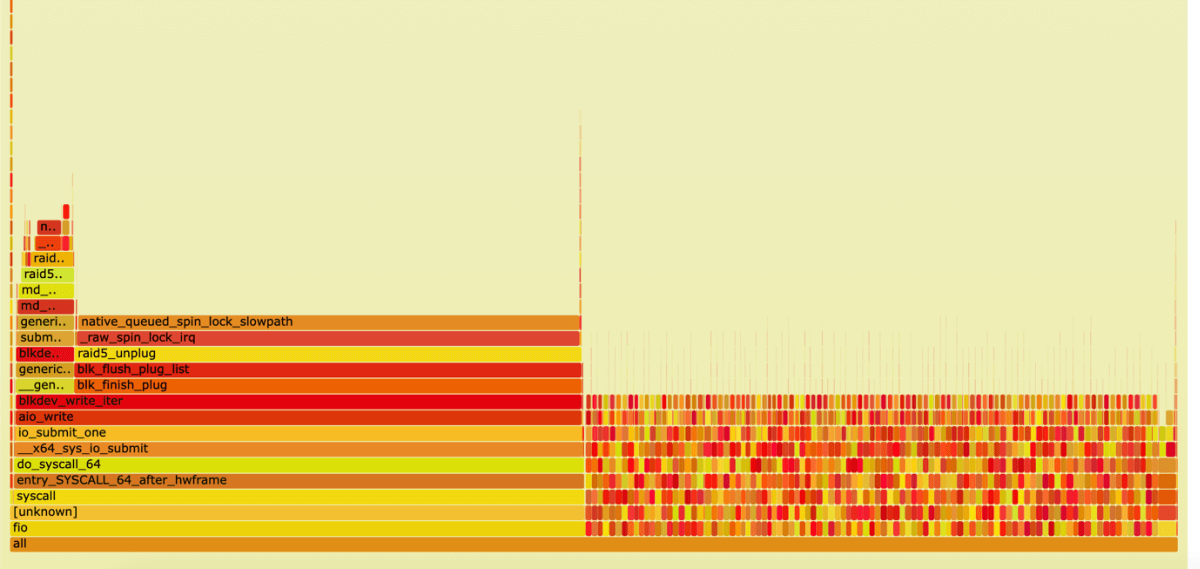
Write:
If we look inside kworker threads, this is what we see.
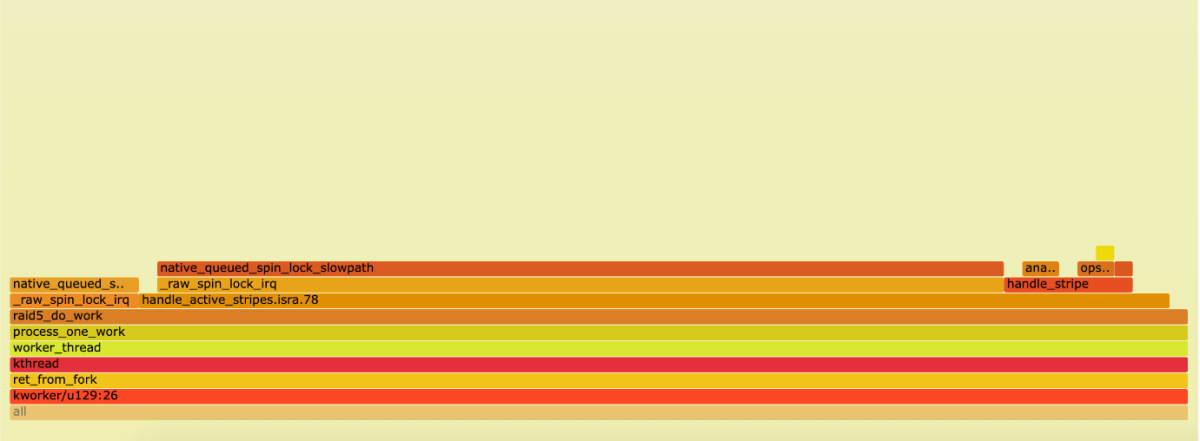
md0_raid5 thread:
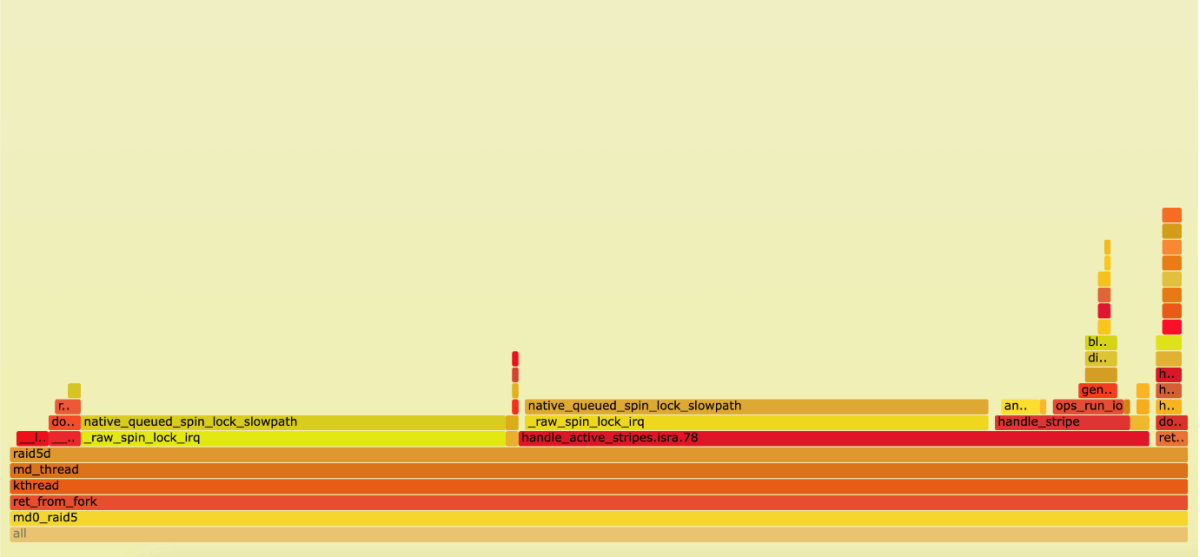
The problem with mdraid performance and high resource consumption (87% of CPU time) is multiple spinlocks.
Results
xiRAID provides higher performance and uses less resources. Even at the maximum load of 22-28% for random operations, half of the load measure with xiRAID is spent on the interaction of the OS kernel with the drives at high speeds. This part of the load is common to any solution working in kernel space, even without RAID. The extra load from xiRAID is only 10-15% and just 2% is spent on working with checksum calculations.
For this reason, using any third-party hardware off-loaders has no advantage in terms of using the resources of modern CPUs, but requires additional expenses: occupies a PCIe slot, creates a potential bottle-neck and complicates resource distribution across NUMA-nodes.
xiRAID is a CPU-assisted RAID designed to get maximum performance of NVMe drives with no use of third-party tools and adding no more than 10-15% extra load.
Anyway, it’s important to choose the right processor, because achieving performance of several million IOps cannot be free in terms of resources that are spent on transferring data from one drive to another.
We recommend modern CPUs with the same number of cores as the number of NVMe drives in the system.
Bonus:
You can reduce the number of resources that are wasted on the Linux kernel-to-hardware interactions by not using the kernel. So, for the performance-critical SPDK solutions we made our own RAID and compared its performance with xiRAID.
We tested our new engine written in user space on the same system and got these results:
Random Read, kIOps
| Num Jobs | xiRAID | Xinnor SPDK RAID |
|---|---|---|
| 1 | 233 | 879 |
| 4 | 874 | 3147 |
| 8 | 1661 | 6136 |
| 16 | 3257 | 6141 |
| 24 | 4439 | 6159 |
| 32 | 5197 | 6308 |
| 48 | 6245 | 6449 |
Random write 4k, kIOPS
| Num Jobs | xiRAID | Xinnor SPDK RAID |
|---|---|---|
| 1 | 133 | 293 |
| 4 | 529 | 977 |
| 8 | 859 | 1164 |
| 16 | 867 | 1066 |
| 24 | 910 | 1059 |
| 32 | 911 | 1013 |
| 48 | 976 | 1059 |
In user space, RAID reaches its maximum at 8 jobs, fully utilizing 8 cores out of 48, i.e. 16%. We’ll show a more detailed analysis of its efficiency in one of the upcoming blog posts.