The following is a guide on how to monitor performance and estimate CPU usage when running the xiRAID engine. It’s crucial to monitor performance as it helps determine the additional resources required to run the software, which can impact the overall cost of the solution. The guide will provide simple and straightforward tools used to avoid typical mistakes that can be made in assessing the load and efficiency of solutions.
We will begin by examining the results received from fio, followed by an analysis of the output generated by the top and htop utilities. Next, we will employ the perf and FlameGraph tools to check the system's performance. Finally, we will conclude by comparing various RAID engines. Click here to scroll down to the results and key takeaways of the blog post.
Typical CPU load estimation errors
Fio report
A system with 16 Western Digital Ultrastar® SN640 drives will be used as an example. One of the most common mistakes is using fio reports to get data. The reason is that fio reports are received by making a system call to getrusage() on the fio processes, and if IO processing is done in the context of other processes, the data will be incorrect.
Additionally, some of our tests show the sys_cpu output from fio is lower at higher loads than at lower loads, which can cause confusion.
We ran tests on a system capable of delivering approximately 12 million IOps, and with a maximum load of 128 jobs each with a queue depth 128, we saw the following CPU load figures:
"usr_cpu" : 14.391282,
"sys_cpu" : 17.735540
And with a load of 64 jobs each with a queue depth 32, the figures are the following:
"usr_cpu" : 16.879827,
"sys_cpu" : 30.892042
iostat and top
Another common mistake is trying to look at the average load figure, which can be received from top and iostat utilities. For instance, a CPU load study from mdraid with a RAID 6 of 16 drives loaded with 128kb sequential writes showed a performance of about 1 GBps. The iostat output gave the false impression that mdraid is efficient in terms of CPU usage and that the bottleneck is elsewhere. However, using htop showed that one of the cores was overloaded and the others were idle.
The top output showed the process md0_raid6, which consumed the core.
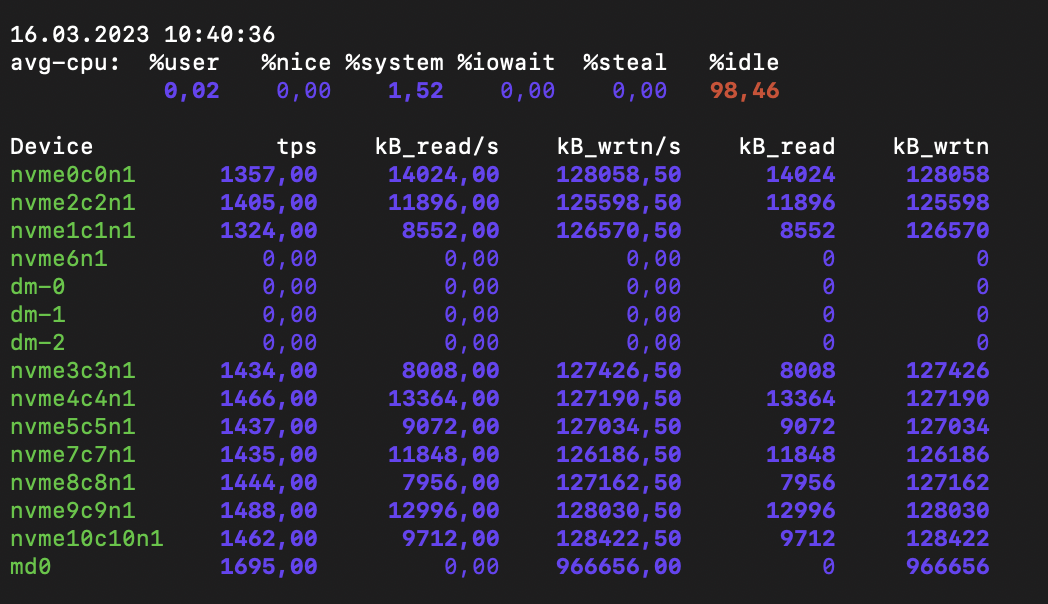
iostat output shows low average CPU usage
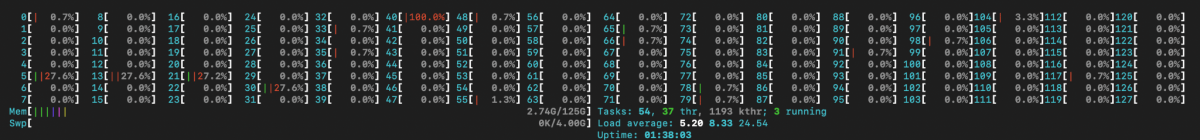
htop output showing overloaded core #40
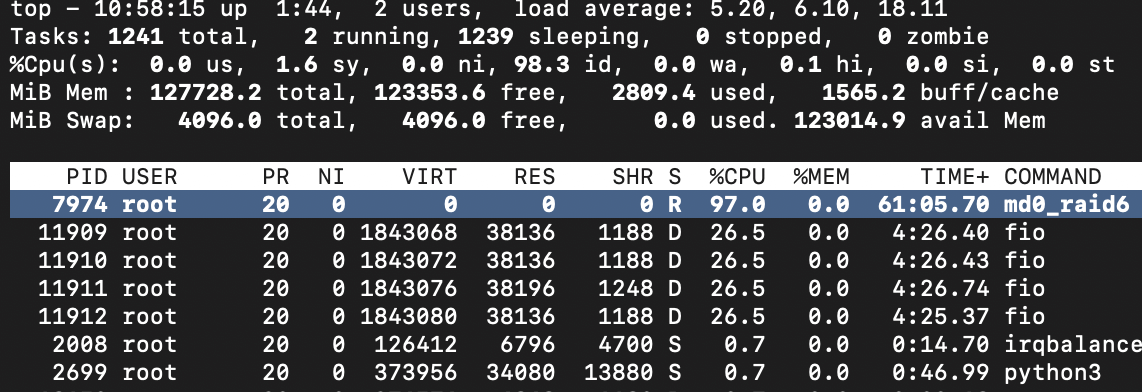
md0_raid6 consumes 100% of the core
How to use top and htop utilities
When using top and htop, it is correct to look at how the load is distributed among the cores and which services create the maximum load. Let's look at the example of mdraid during sequential write after improving its performance a little.
Tuning with the following command resulted in a mdraid performance increase of over three times: echo 64 > /sys/block/md0/md/group_thread_cnt. This enables workqueue offload handling of RAID6 stripes. Our aim is to get the best figures for each engine for an objective comparison.
Let's take a look at the top and htop output.
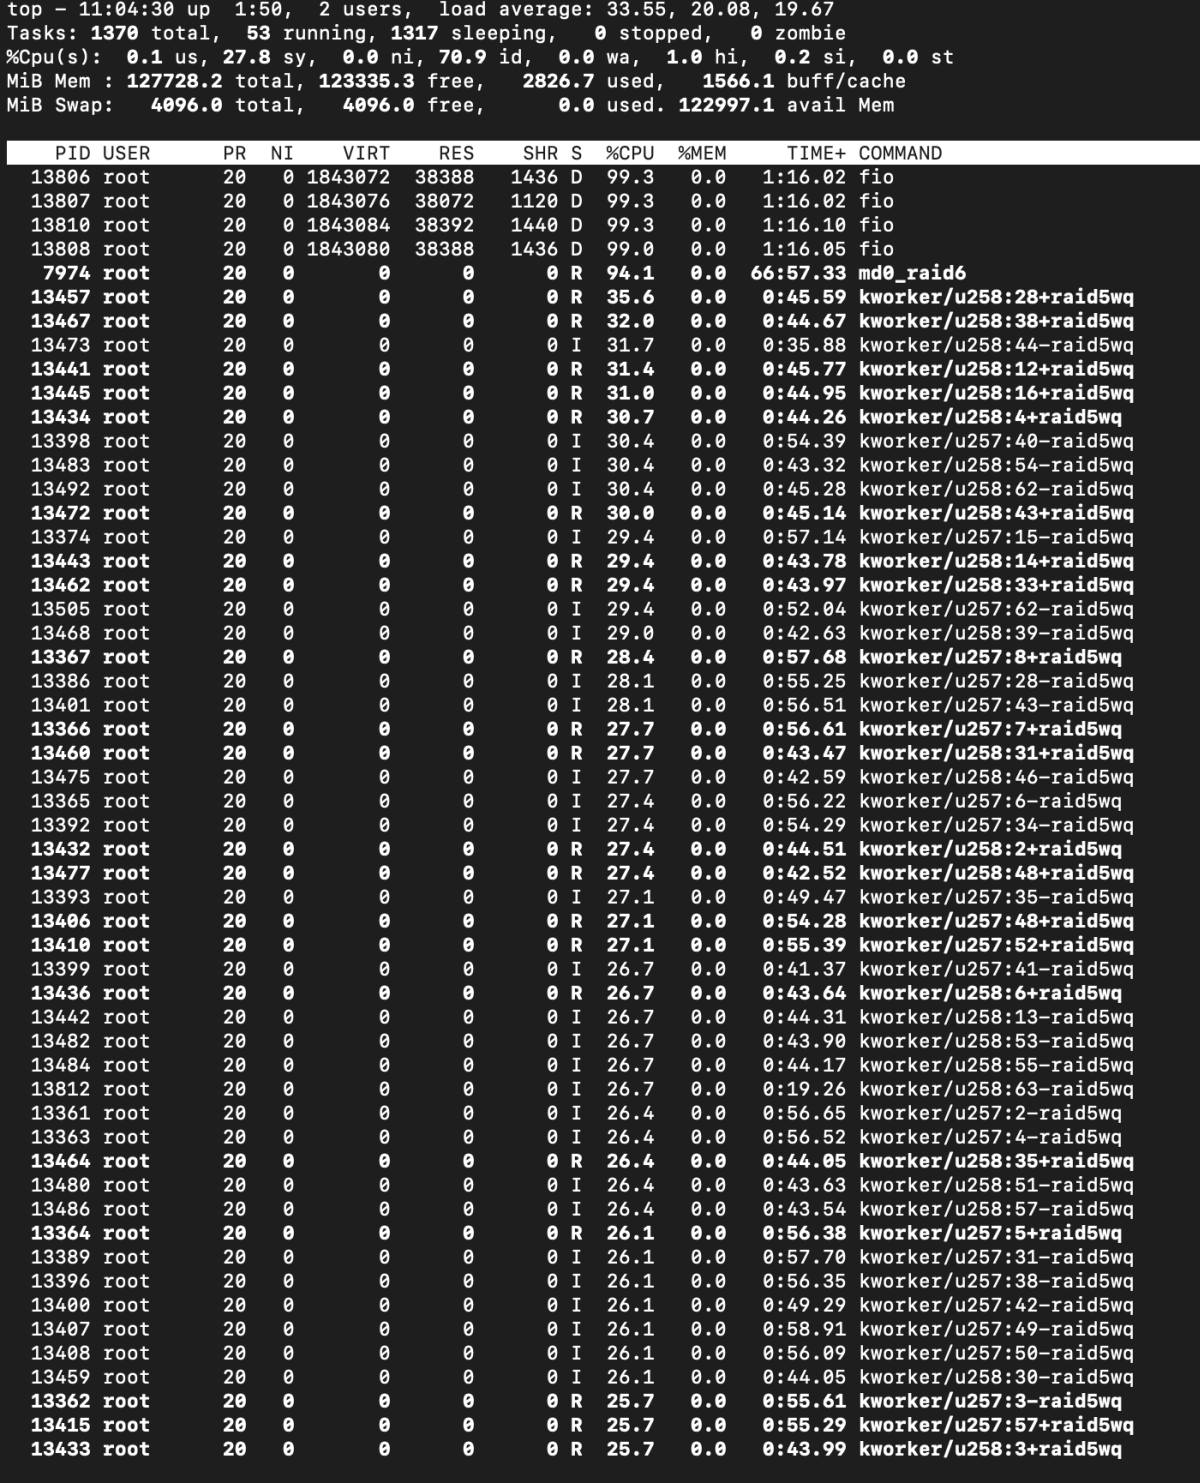
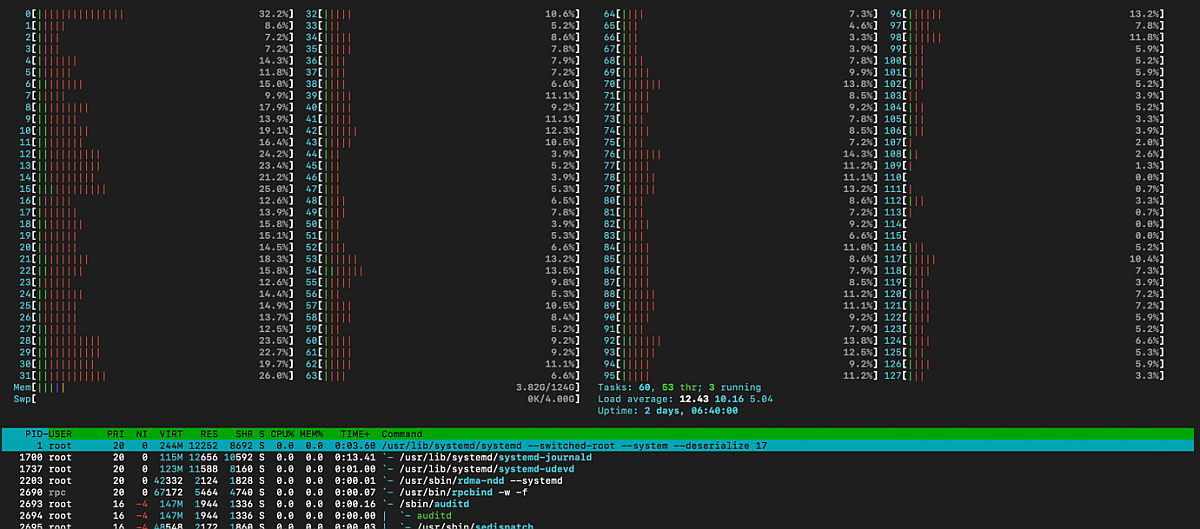
top output after mdraid tuning
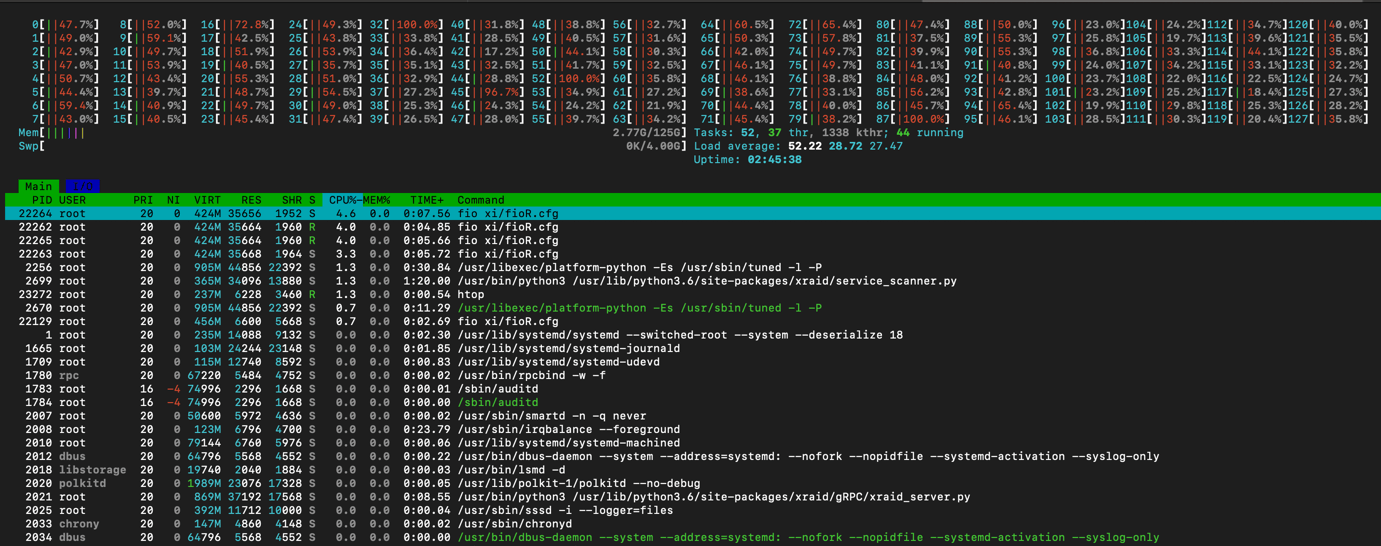
htop output after mdraid tuning
Despite the use of offloading, the performance of mdraid remains restricted, and it fully utilizes four cores. These four cores are consumed by the fio process. It is crucial to gain a deeper understanding of the workload and identify the specific operations that are causing mdraid to generate this load.
Exploring system behaviour with FlameGraph
To monitor the performance and estimate the CPU usage, it is important to use simple and straightforward tools. For instance, using bcc and FlameGraph for performance profiling involves running the following commands:
cd FlameGraph,
/usr/share/bcc/tools/profile -F 99 -adf 60 > out.profile-folded,
/flamegraph.pl --colors=java out.profile-folded > profile.svg
Alternatively, perf can be used instead of bcc, which results in a higher level of overhead. The following command can be used:
perf script | ./stackcollapse-perf.pl > out.perf-foldedMD,
./flamegraph.pl out.perf-foldedMD > perfMD.svg
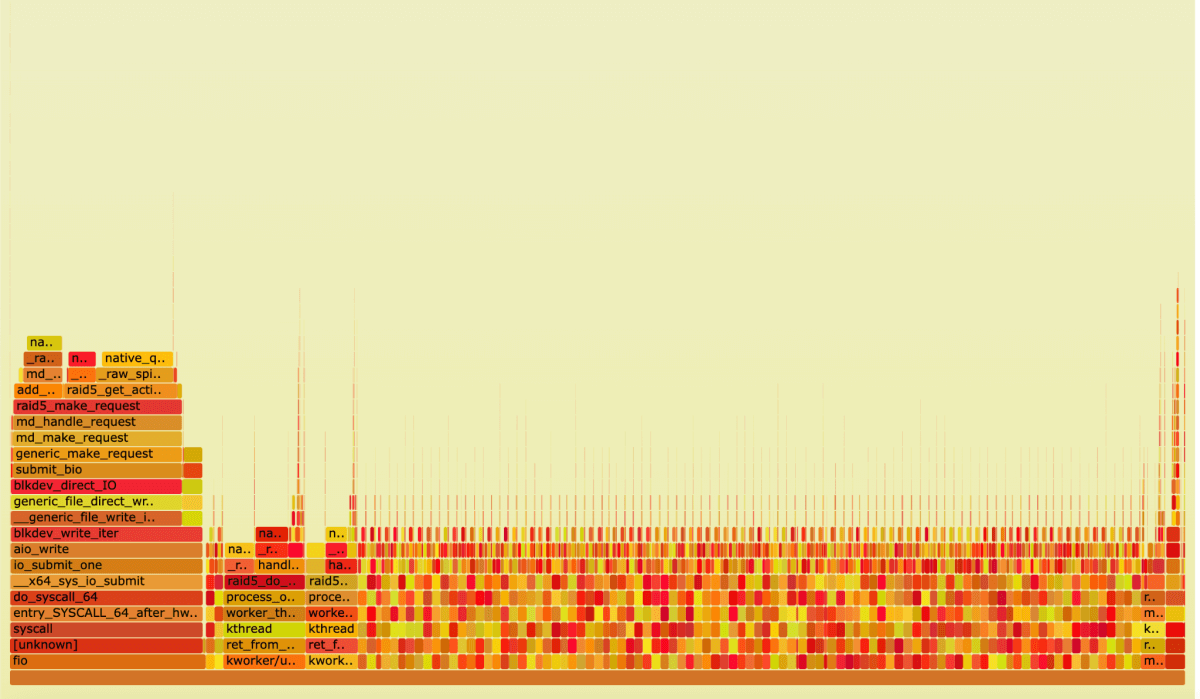
FlameGraph, mdraid under sequential write load
To calculate the total impact on CPU load, we can use the formula Func_Samples_num/(CPU_cores*F*60), where Func_Samples_num is the number of samples collected for a particular function, CPU_cores is the number of CPU cores, and F is the frequency at which samples were collected.
To measure the CPU load, we need to add up the time spent in all the relevant functions. The result for mdraid is the following CPU load estimate: 35.7%
Now that we are familiar with the tools, let's compare the behaviour of the RAID engines.
Comparison of RAID engines in terms of CPU load
Two CPU intensive tasks were examined: sequential write and sequential reads in failover mode, requiring a lot of checksum calculations and data recovery using parity-based RAID levels. For the experiments, mdraid, ZFS RAIDZ, and xiRAID were used, and the tools utilized were htop, top, bcc, perf, and FlameGraph.
We are experimenting with RAID 6, but the results are similar for single and triple parity RAID configuration.
We are examining RAID performance under 128kb sequential write loads. In this configuration, the total write throughput on the drives is 40GBps. We will run all our tests with the following configuration:
strip_size:64k
all advanced features: switched off
We have configured ZFS according to our recommendations in the following blog post to achieve the best results.
The fio configuration file is straightforward and looks like this:
ioengine=libaio
direct=1
bs=128k
rw=write/read
iodepth=32
numjobs=8
runtime=1200
time_based=1
norandommap
offset_increment=10%
[job]
filename=/dev/md0
MDRAID test
The output of top and htop for mdraid under load looks like this:
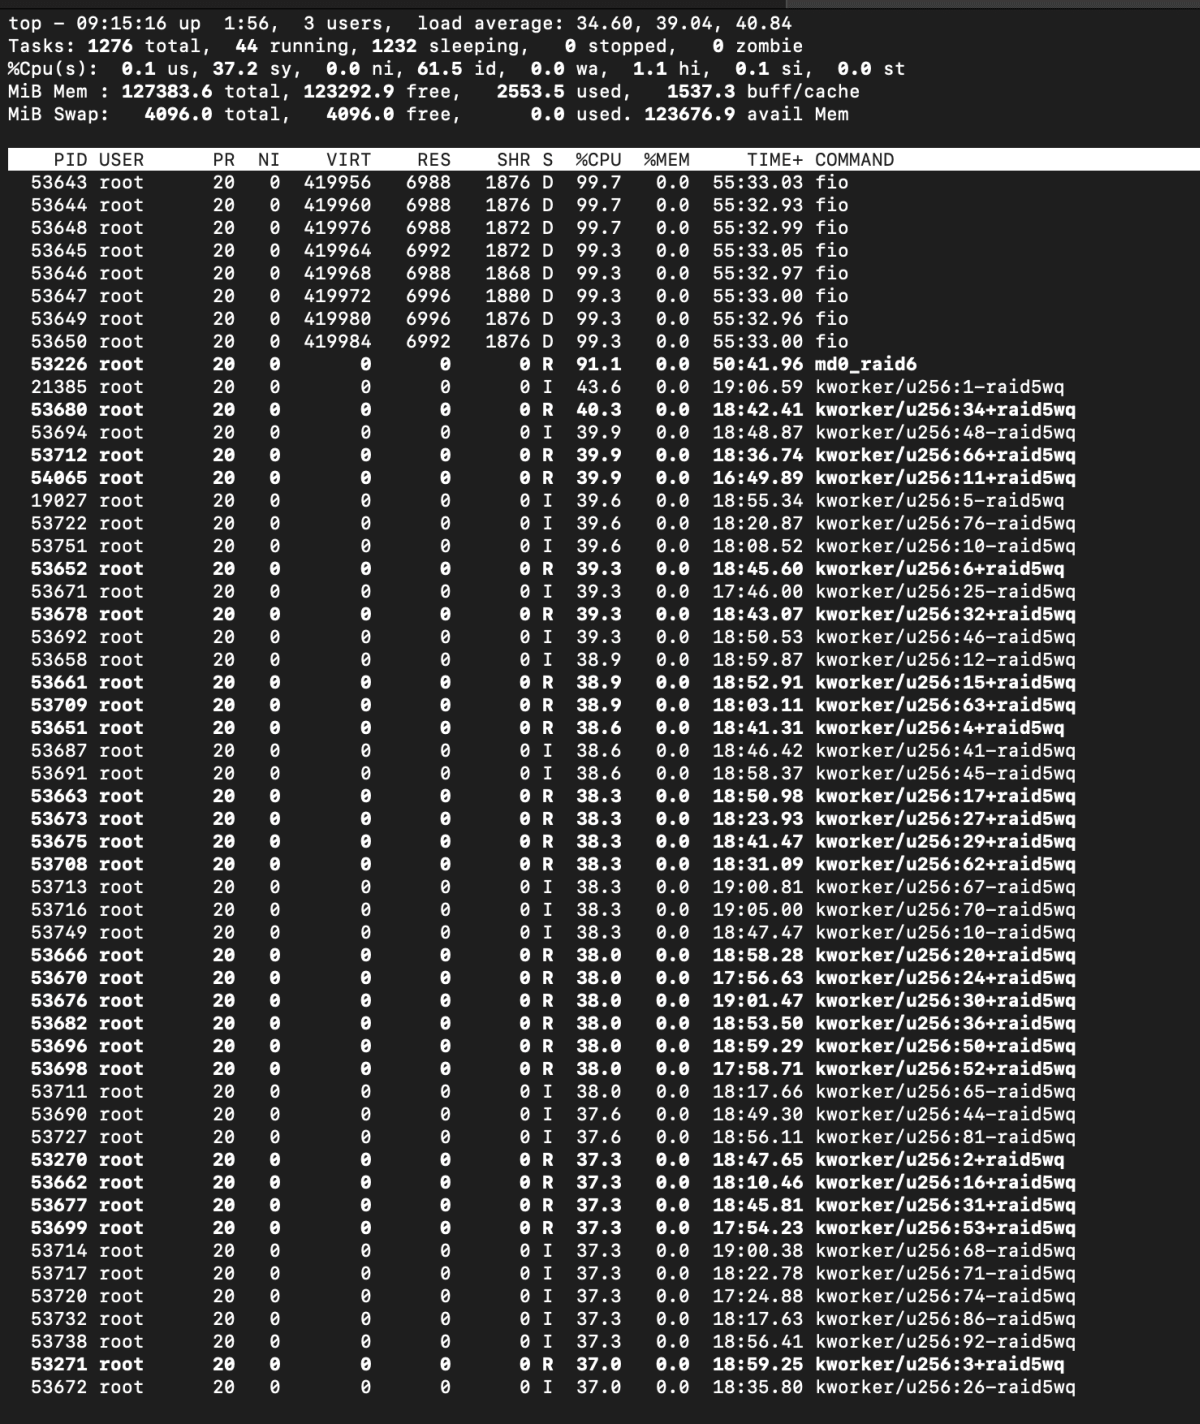
top output, mdraid write load
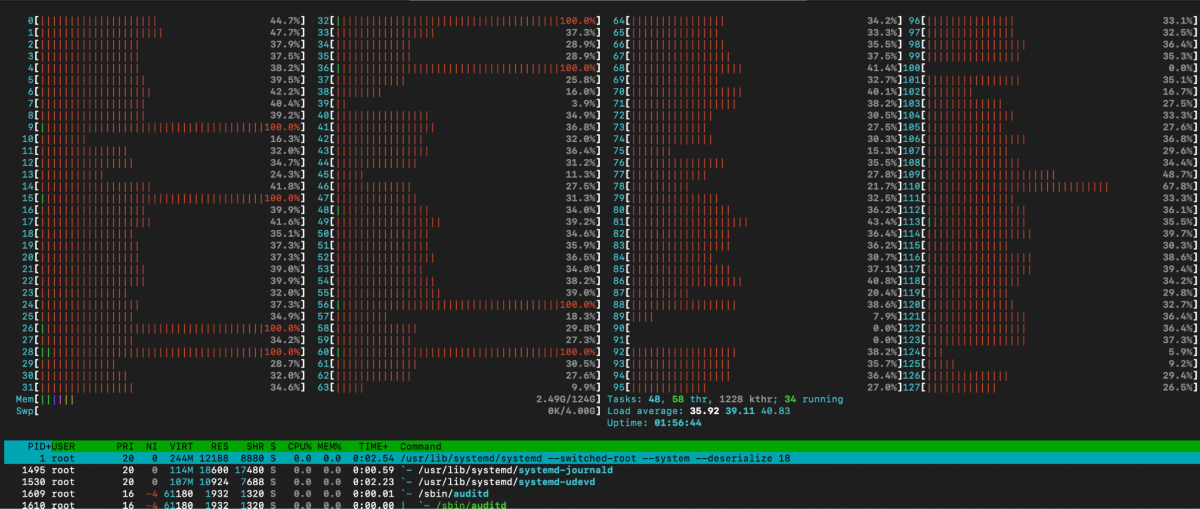
htop output, mdraid write load
We see overloaded cores.

FlameGraph, mdraid under sequential write load
By analyzing the FlameGraph, we can see that the CPU is mostly occupied by the processes md0_, kworker_, and functions running in the context of fio.
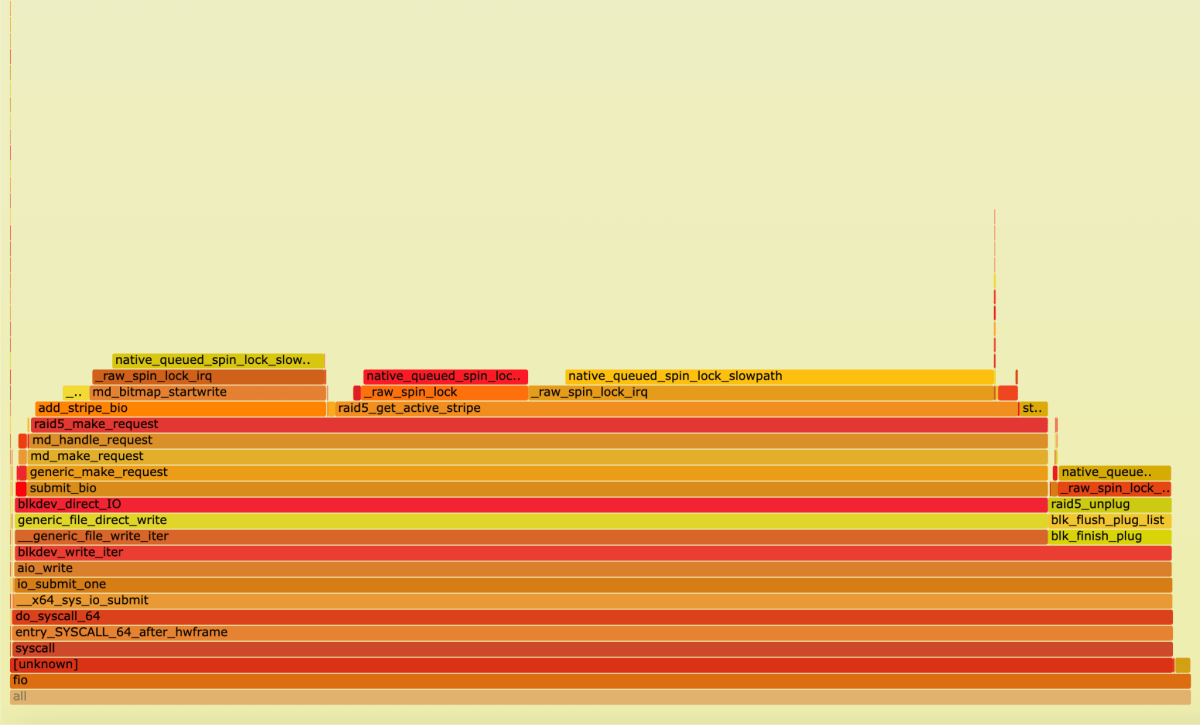
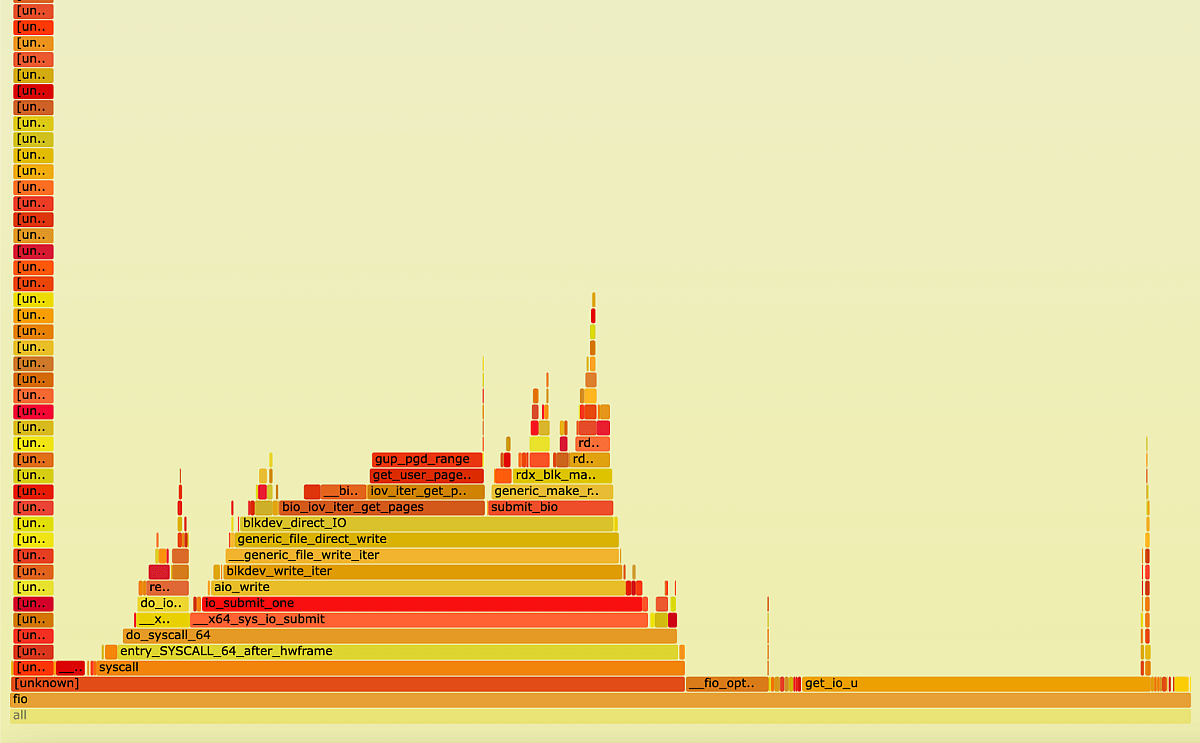
FlameGraph, fio process closer look
Many operations are performed in the fio context and here you see a plateau, which is the reason for the low performance.
xiRAID test
Next, we will perform the same analysis for xiRAID. In this configuration, the array performance is 37GBps, and according to the top output, the total CPU load is only 13% according to htop.
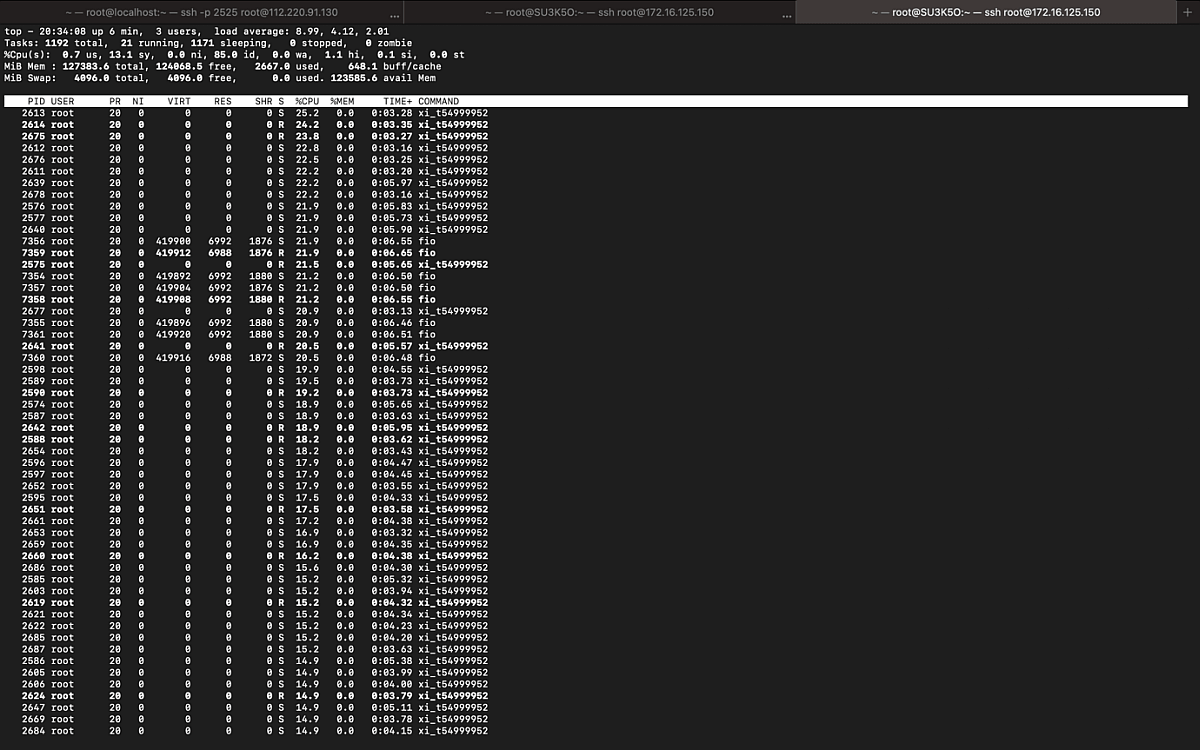
top output, xiRAID sequential write
htop output, xiRAID sequential write
It can be seen that most of the time is spent on the syndrome calculation function. However, a number of functions are also performed in the fio context.
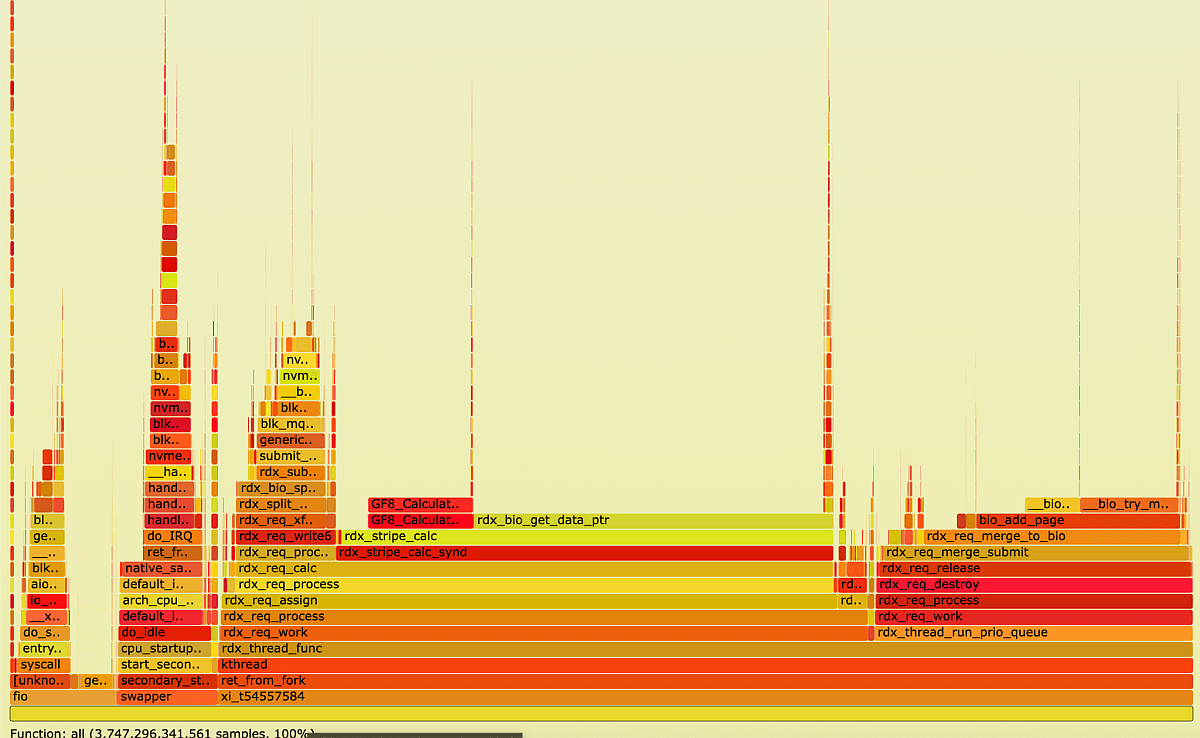
FlameGraph, xiRAID under sequential write load
FlameGraph fio process closer look
Calculating this manually can be challenging, which is why we have developed a straightforward script. In the upcoming blog post, we will provide a detailed explanation of the script.
As for the results of xiRAID, the CPU time consumption accounts for 79.3% of the total CPU load, which is 13.7%. This translates to 10.3% of the overall system load.
Now, let's shift our focus to ZFS.
ZFS test
The writing performance of ZFS is 3.5 GBps.
The performance is quite different from what we described in the previous blog post, because we did not enable DIRECT_IO
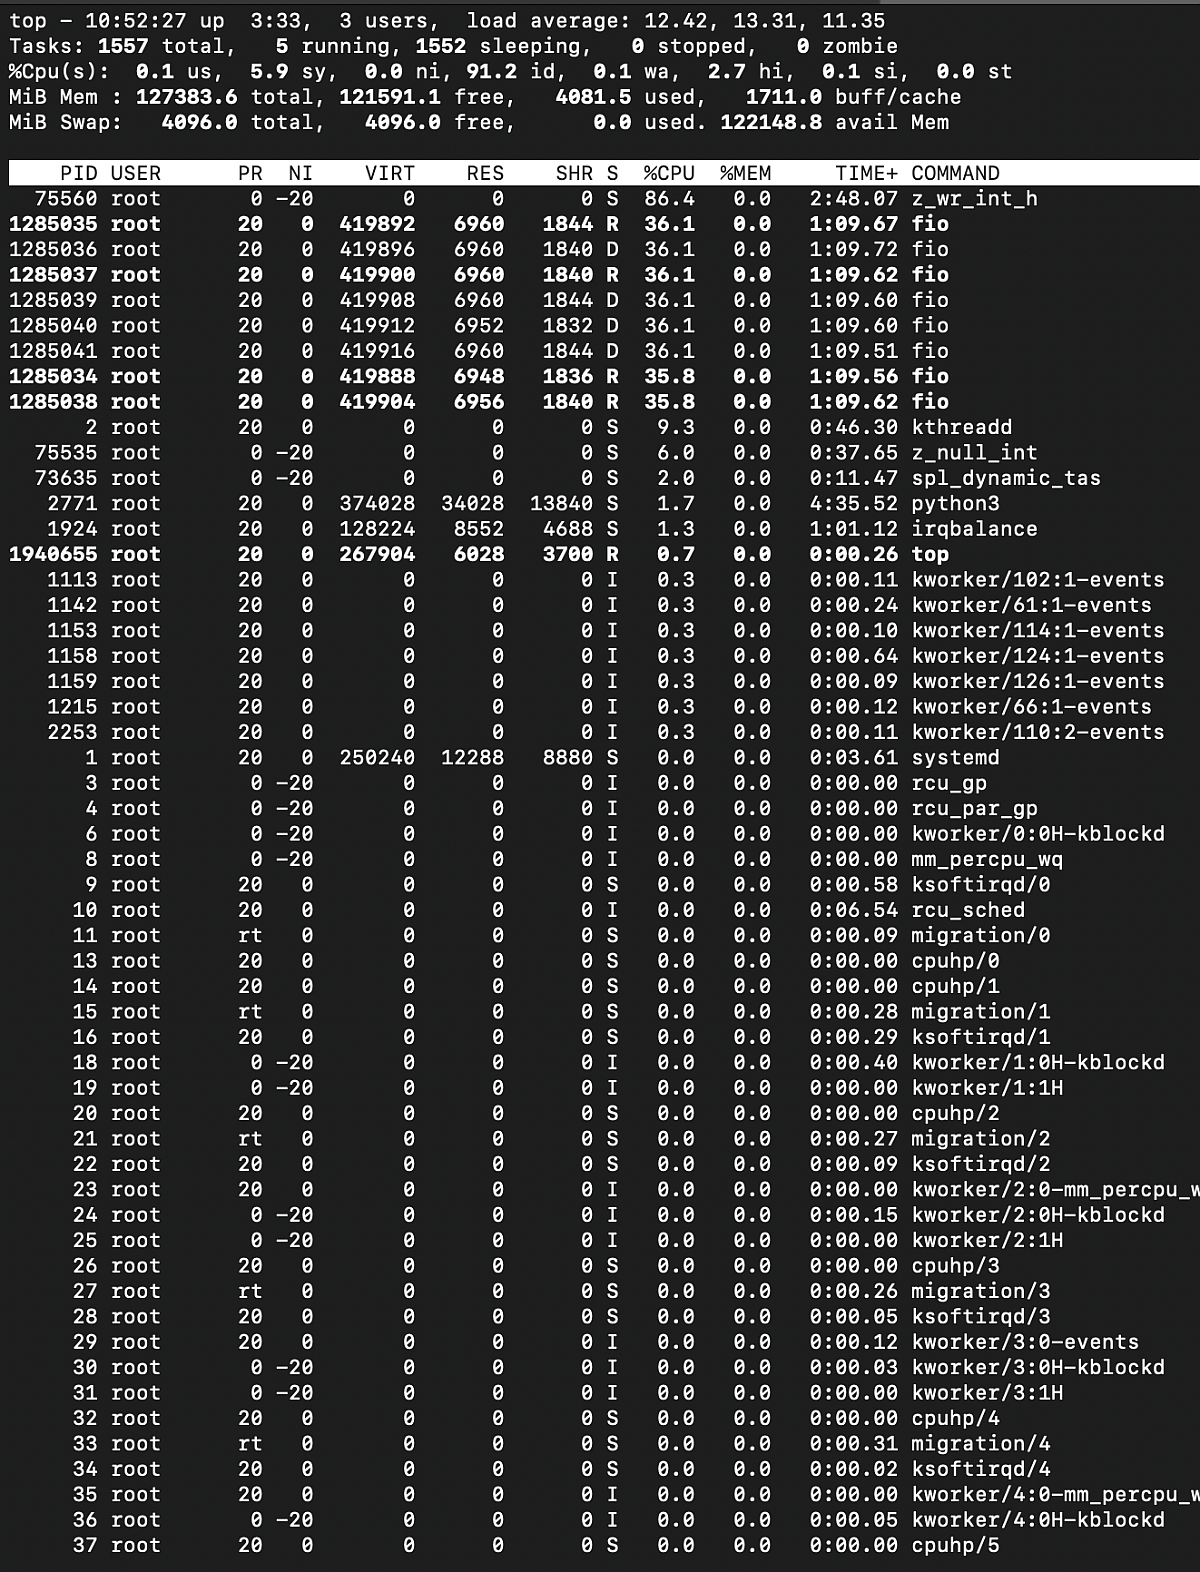
top output, zfs RAIDZ2 under sequential write load
We can observe that some processes consume a lot of CPU time (fio and z_wr_int_h), similar to mdraid.
Also, we see an unbalanced load of cores on htop output.
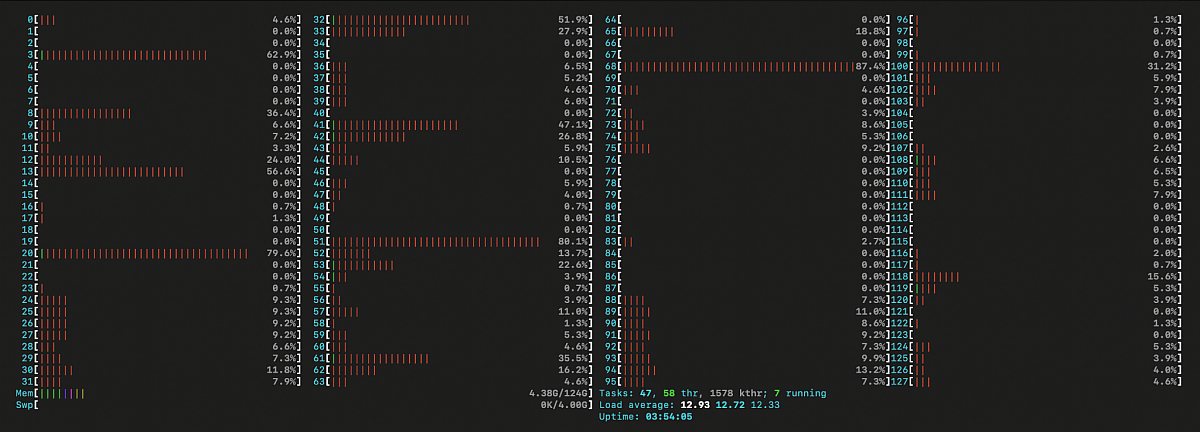
htop output, zfs write test
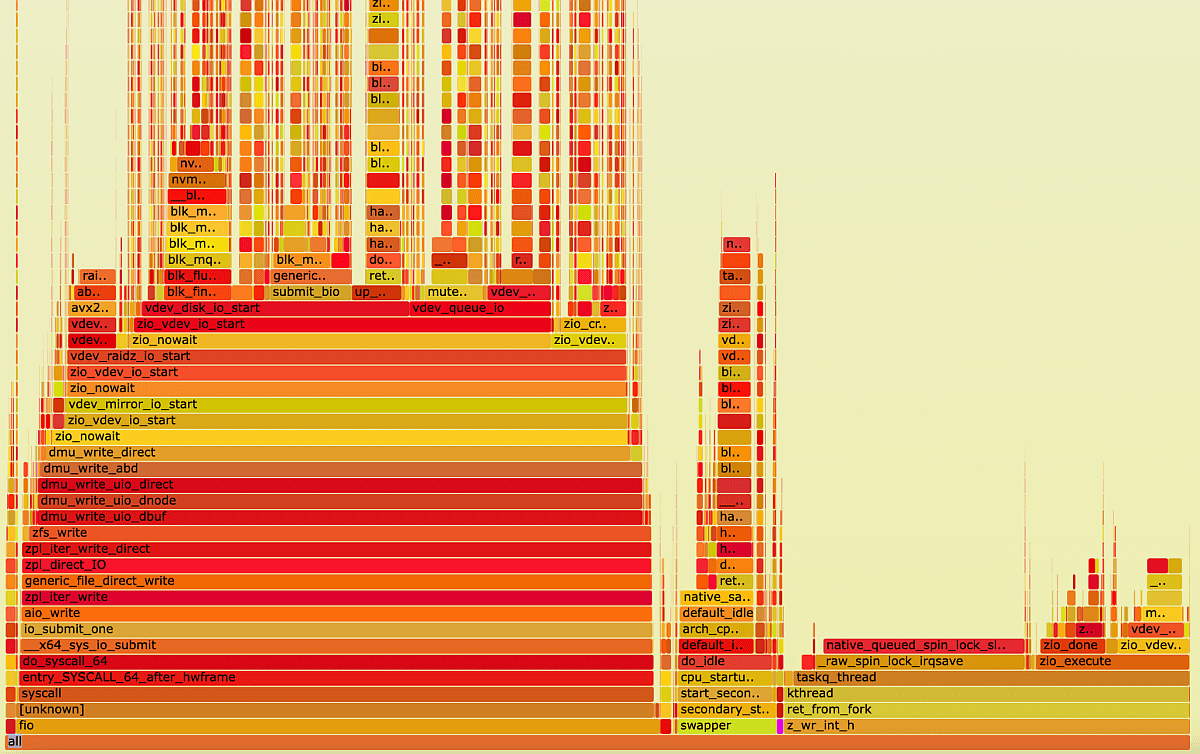
FlameGraph, zfs RAIDZ2 under sequential write load
When using mdraid and ZFS RAIDZ2, some processes are responsible for the unbalanced load of the CPU cores. This means that during heavy workloads, some cores can become heavily loaded while the others still have resources. On the other hand, xiRAID is designed to distribute the load evenly across all available CPU cores. This helps to prevent any one core from becoming overloaded while others remain underutilized.
This difference in load distribution can have significant implications for system performance. In situations with multiple tasks running concurrently, a load-balancing approach like that used by xiRAID may lead to more efficient resource utilization and better overall performance. On the contrary, a system that relies on a single core to handle heavy workloads may suffer from bottlenecks and reduced performance.
Degraded Reads test
During a degraded read with two failures, the behavior of the 'engines' can provide valuable insights. This scenario refers to the situation where two drives fail in a RAID system, and the system is still able to operate, but with a degraded performance. In such a scenario, the performance of the RAID system can be a critical factor in determining its usability and efficiency.
In this case, observing the behavior of different RAID 'engines' systems can provide insights into their effectiveness. For instance, if a RAID system is able to distribute the load evenly across its drives even during a degraded read with two failures, it is likely to provide better performance and reliability than a system that cannot. On the other hand, if a RAID system loads one of its cores heavily during a degraded read, it may indicate a bottleneck in the system that can affect its performance.
Therefore, analyzing the behavior of RAID systems during a degraded read scenario can help in determining their reliability, efficiency, and performance.
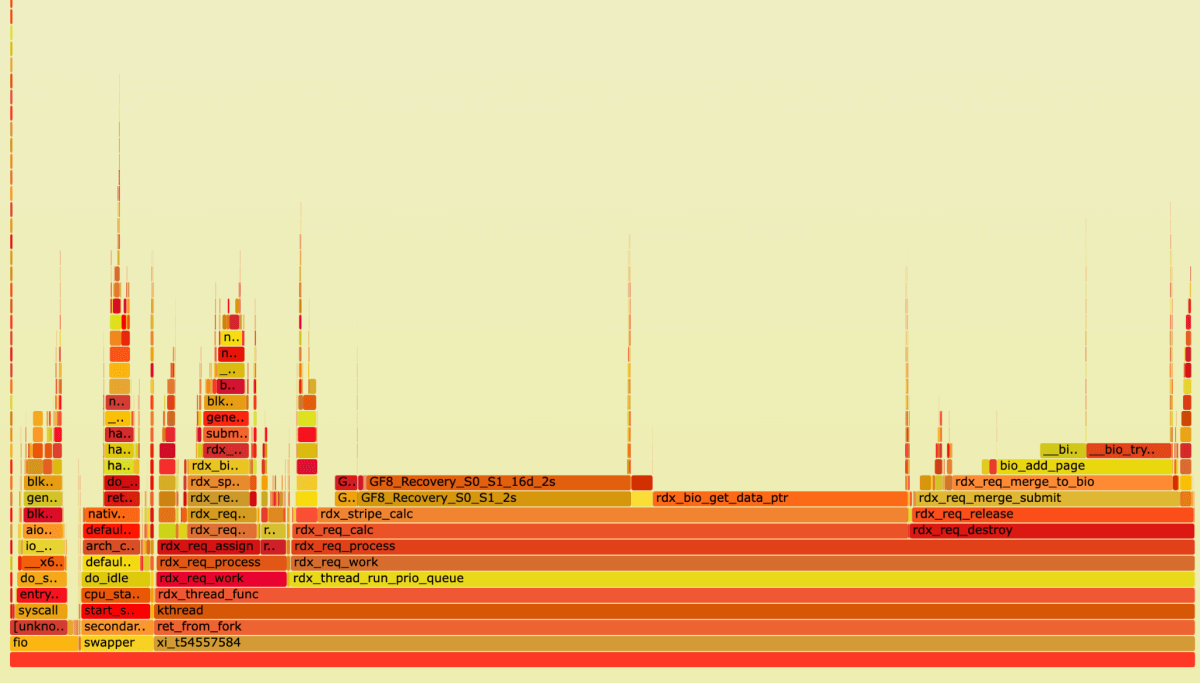
FlameGraph, xiRAID degraded read test
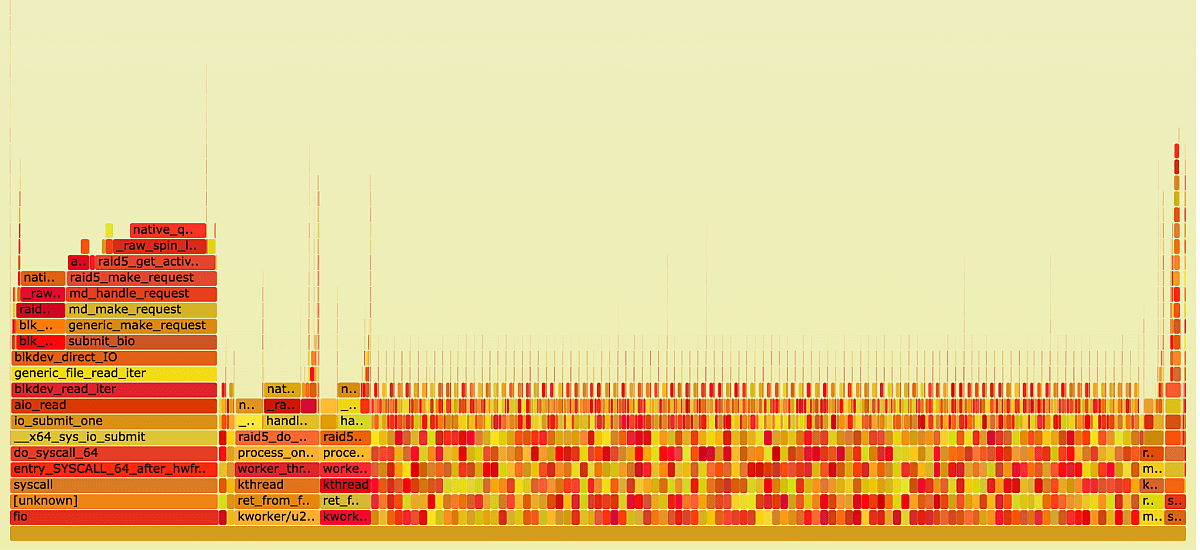
FlameGraph, mdraid degraded read test
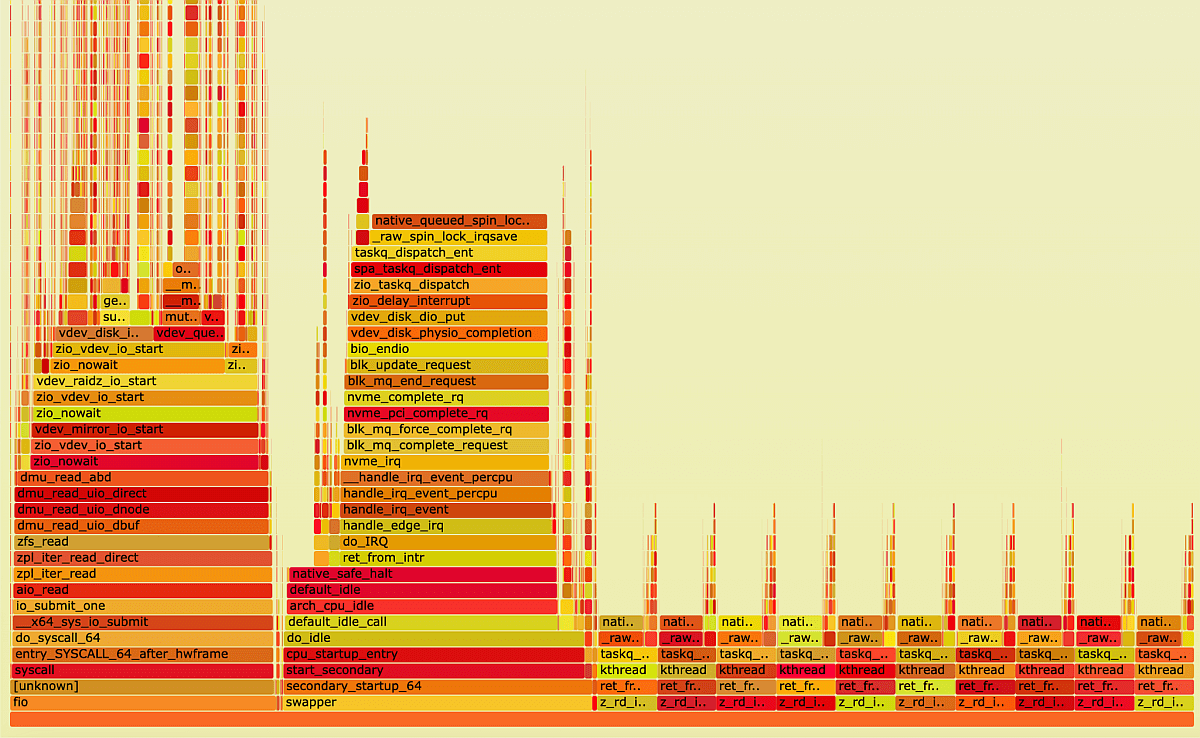
FlameGraph, zfs degraded read test
Again, thanks to its architecture, xiRAID spends most of its time recovering data. This work is distributed evenly across all cores. This means that even during a degraded read with two failures, xiRAID is able to maintain a relatively balanced workload across all cores, resulting in a smoother and more efficient recovery process.
In contrast, mdraid loads only one core (take a look at the fio process), which can lead to that core being overloaded during a degraded read with two failures. This can result in slower recovery times and reduced system performance overall.
To summarize our findings, we will now examine the CPU time consumed by the engines we studied:
Sequential writing on RAID6
| Workload | xiRAID performance, GB/s | MDRAID 6 performance, GB/s | RAIDZ2 performance, GB/s | Avg CPU Load by xiRAID, % | Avg CPU Load by MDRAID, % | Avg CPU Load by RAIDZ2, % | The most consumed cores, xiRAID | The most consumed cores, MDRAID 6 | The most consumed cores, RAIDZ2 |
|---|---|---|---|---|---|---|---|---|---|
| 1 queue 32 deep | 7.7 | 3.0 | 0.9 | 1.8 | 2.7 | 3.2 | 1x4% | 1x90% | 1x60% |
| 2 queues 32 deep | 14.8 | 3.7 | 1.6 | 3.5 | 6.6 | 5.6 | 2x5% | 3x90% | 2x56% |
| 4 queues 32 deep | 28.5 | 3.9 | 3.5 | 6.8 | 14.7 | 7.8 | 4x7% | 5x100% | 1x70% |
| 8 queues 32 deep | 37.3 | 3.1 | 3.6 | 10.3 | 35.7 | 8.1 | 8x11% | 9x100% | 1x100% |
Sequential reading with 2 failed drives
| Workload | xiRAID performance, GB/s | MDRAID 6 performance, GB/s | RAIDZ2 performance, GB/s | Avg CPU Load xiRAID, % | Avg CPU Load MDRAID, % | Avg CPU Load RAIDZ2, % | The most consumed cores, xiRAID 6 | The most consumed cores, MDRAID 6 | The most consumed cores, RAIDZ2 |
|---|---|---|---|---|---|---|---|---|---|
| 1 queue 32 deep | 8.0 | 4.1 | 1.0 | 3.3 | 4.0 | 1 | 1x6% | 2x100% | 1x45% |
| 2 queues 32 deep | 12.0 | 6.1 | 1.1 | 4.2 | 10 | 2.7 | No spikes | 3x100% | 3x30% |
| 4 queues 32 deep | 21.0 | 6.8 | 2.5 | 8.4 | 20 | 9 | No spikes | 5x100% | 4x26% |
| 8 queues 32 deep | 37.5 | 6.0 | 3.0 | 14.3 | 31.9 | 17 | No spikes | 9x100% | 8x20% |
Key takeaways
- It's important to monitor load balancing across cores to ensure that the workload is being distributed evenly.
- Instead of just relying on percentages in htop to evaluate performance, it's recommended to use perf or bcc output for a more detailed analysis.
- During normal operation, xiRAID uses significantly fewer CPU resources compared to mdraid and ZFS RAIDZ2 while using them more efficiently. This is because xiRAID distributes the workload evenly across all available cores, while mdraid (for Writes and Degraded Reads) and ZFS RAIDZ2 (for Writes) load only a part of cores.
- We see that much of mdraid's work takes place in the context of FIO and possibly another client application, resulting in poor performance of that application.